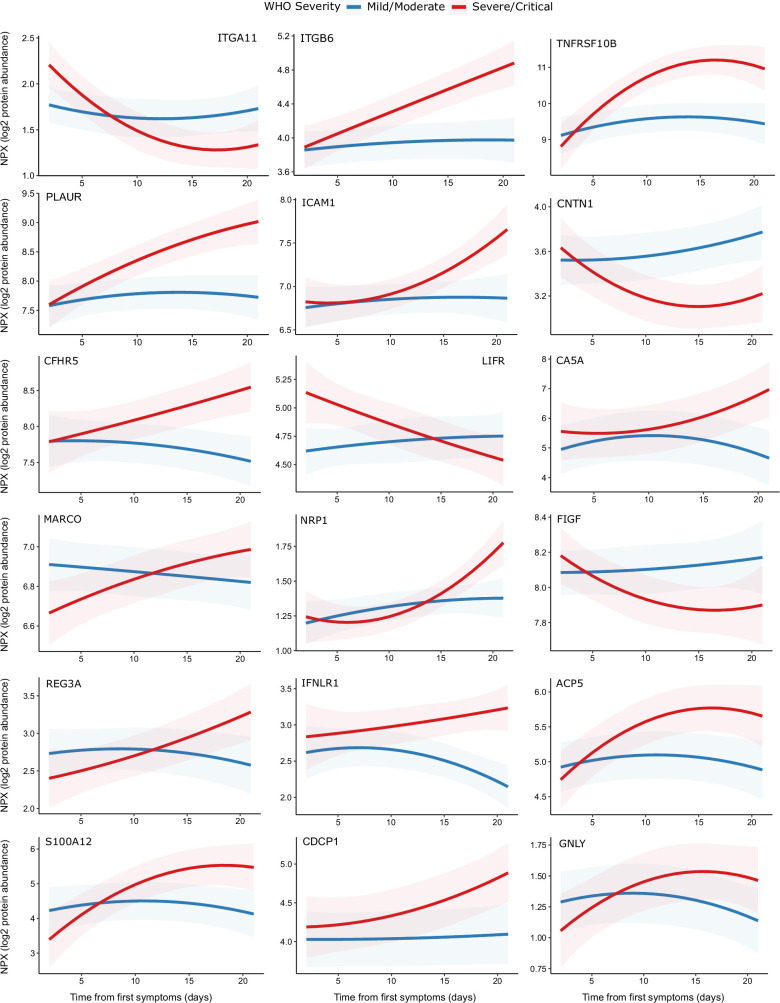
Figure 9. Modelling of temporal protein trajectories.
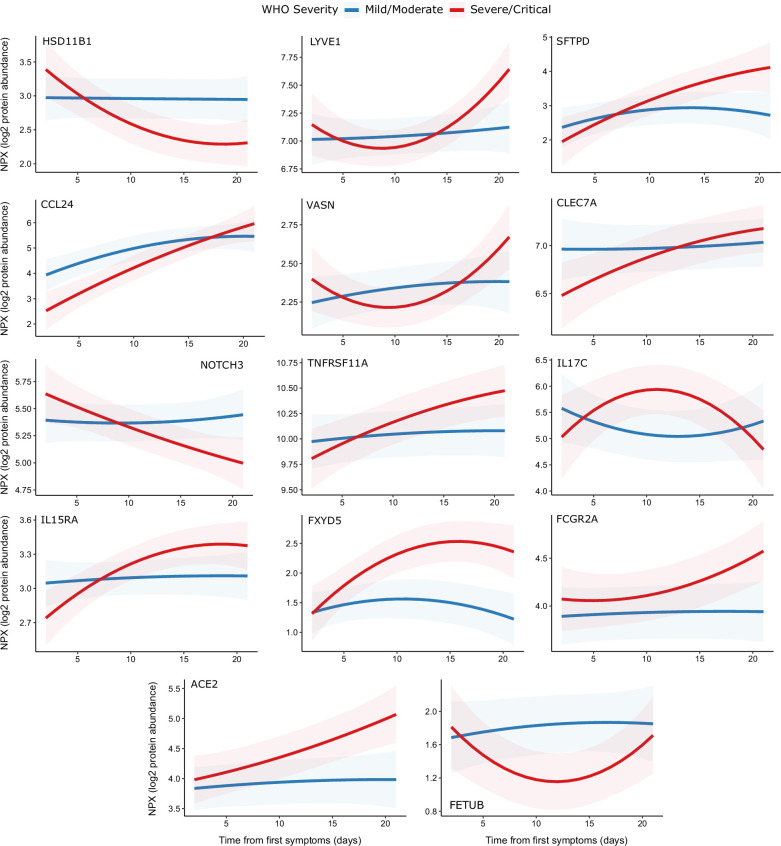
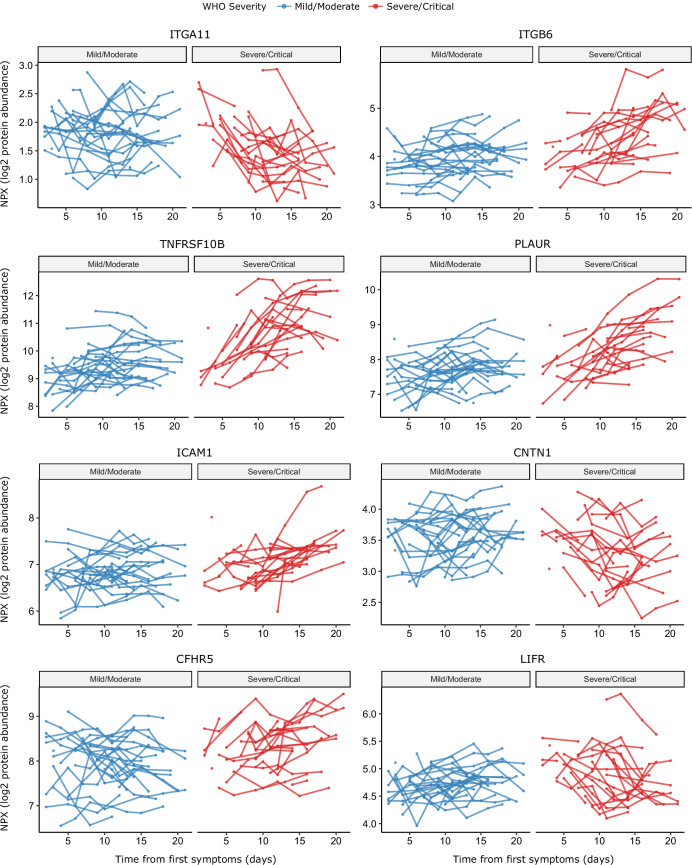
The top 18 proteins displaying the most significantly (5% FDR) different longitudinal trajectories between patients with a mild or moderate (n = 28) versus severe or critical (n = 27) overall clinical course (defined by peak WHO severity). Means and 95% confidence intervals for each group, predicted using linear mixed models (see Materials and methods), are plotted. The remainder of significant proteins are shown in Figure 9—figure supplement 1. Individual data points are shown in Figure 9—figure supplement 2.


