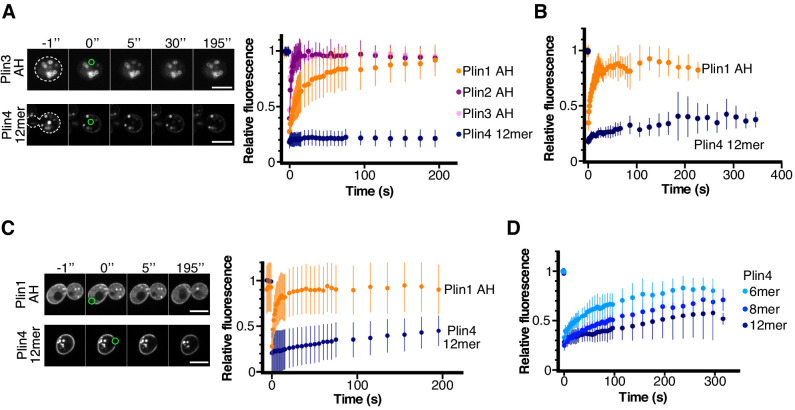
Figure 4. Dynamics of perilipin AH-GFP fusions on LDs or at the plasma membrane in yeast.
(A) Dynamics of AH-GFP fusions on LDs in pet10Δ cells grown for 48 hr in oleic acid. Images show two representative FRAP time-courses in cells expressing Plin3 AH-GFP (top panels) or Plin4 12mer-GFP (bottom panels); time (in seconds) is indicated on top. Cells are outlined in white and the bleached areas containing one LD are outlined in green. Graph shows recovery curves for Plin1 AH-GFP (n = 29), Plin2 AH-GFP (n = 14), Plin3 AH-GFP (n = 16), or Plin4 12mer-GFP (n = 24). (B) Recovery curves for Plin1 AH-GFP (n = 11) or Plin4 12mer-GFP (n = 5) on LDs in pet10Δ cells in late exponential phase (small LDs). (C) FRAP of Plin1 AH (n = 14) and Plin4 12mer (n = 15) at the PM in exponentially growing pet10Δ cells. Images show two representative time-courses for Plin1 AH (top) and Plin4 12mer (bottom). Bleached areas are outlined in green. (D) FRAP of Plin4 6mer-GFP (n = 12), Plin4 8mer-GFP (n = 7) and Plin4 12mer-GFP (n = 7) at the PM in exponentially growing wild-type cells. All graphs show the mean ± SD of the fluorescence recovery curves from n FRAP measurements on different LDs or different regions of the PM, as shown in the images. Scale bar: 5 µm.


