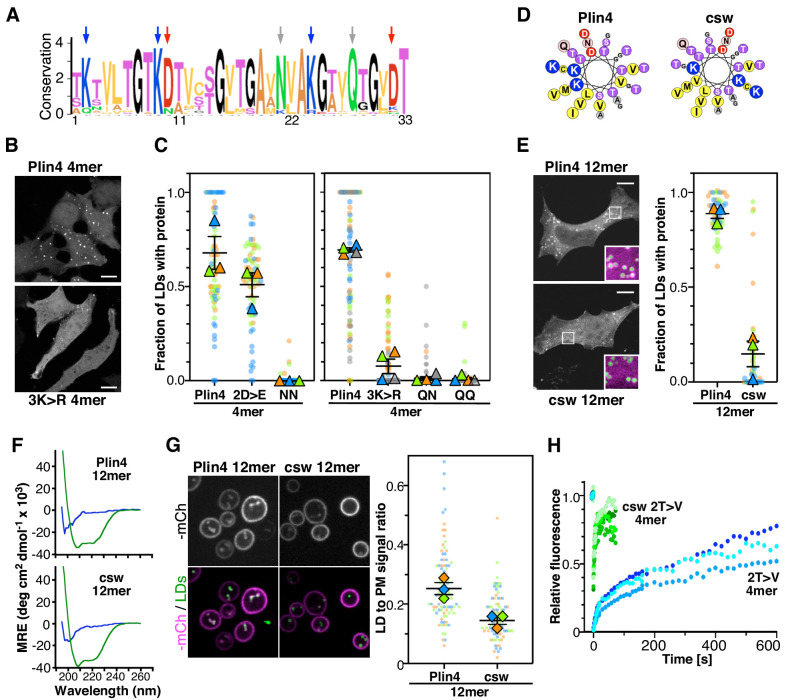
Figure 6. The polar face of Plin4 AH is key for specific and stable coating of LDs in cells.
(A) Weblogo plot of the AH region of human Plin4 as determined by aligning its 29 33-mer repeats. The vertical arrows indicate the mutated aa: the NQ pair (gray), which was mutated into NN, QQ or QN; the three K (blue), which were mutated into R, and the two D (red), which were mutated into E. (B) Co-localization of GFP-Plin4 4mer wild-type and 3K > R (in white) with LDs (purple) in HeLa cells. (C) Quantification of the percentage of LDs stained with the indicated protein per cell. These ‘SuperPlots’ (Lord et al., 2020) show all data fom three to four independent experiments, each with a different color; each light dot represents one cell, whereas each triangle shows the mean from one experiment. The black bars show the mean ± SE of three to four independent experiments. (D) Helical wheels of Plin4 WT and csw mutant. (E) Localization of Plin4 12mer wild-type or csw mutant in HeLa cells. The insets show extended views with the protein in purple and LDs in green (stained with Bodipy). The super plots show the mean ± SE of the % of LDs positive for the indicated protein per HeLa cell as determined from three independent experiments. (F) CD spectra of Plin4 12mer (5 μM) and csw 12mer (7.5 μM) in solution (blue) or in an equal volume of buffer and TFE (green). (G) Light microscopy images of mCherry fusions of Plin4 12mer wild-type or csw mutant in yeast. Top: mCherry fluorescence (mCh); bottom co-localization of mCherry (purple) with LDs stained with bodipy (green). The relative fluorescence signal of mCherry fusions of Plin4 12mer wild-type or csw mutant on LDs and at the PM in PET10-GFP yeast strain was used to build the SuperPlots shown on the right. Data are from three independent experiments, with n ≥ 25 for each condition in each assay. (H) Fluorescence recovery curves of mCherry fusions of Plin4 4mer 2T > V (green points) and 2T > V csw mutants (blue points) on LDs in HeLa cells. Each curve represents FRAP of a single LD in one cell.


