Figure 1.

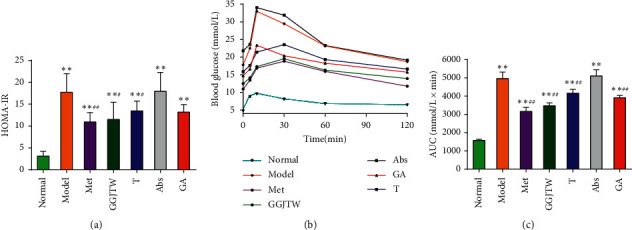
(a) HOMA-IR; (b) OGTT; (c) AUC. Met group, N = 7, and the other groups, N = 10. ∗P < 0.05, ∗∗P < 0.01 to the normal group; #P < 0.05, ##P < 0.01 to the model group. One-way ANOVA was used for statistical analysis.

(a) HOMA-IR; (b) OGTT; (c) AUC. Met group, N = 7, and the other groups, N = 10. ∗P < 0.05, ∗∗P < 0.01 to the normal group; #P < 0.05, ##P < 0.01 to the model group. One-way ANOVA was used for statistical analysis.