Figure 5.

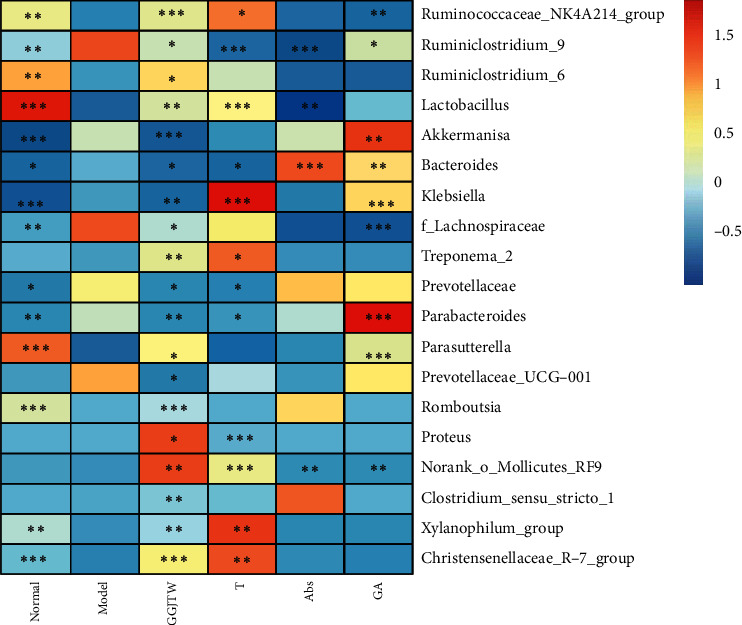
Heatmap of the differential bacteria in the top 50 most abundant genera. The data were normalized with the z-score method. Student's t-test was conducted between the model group and every other group. ∗P < 0.1, ∗∗P < 0.05, and ∗∗∗P < 0.01.

Heatmap of the differential bacteria in the top 50 most abundant genera. The data were normalized with the z-score method. Student's t-test was conducted between the model group and every other group. ∗P < 0.1, ∗∗P < 0.05, and ∗∗∗P < 0.01.