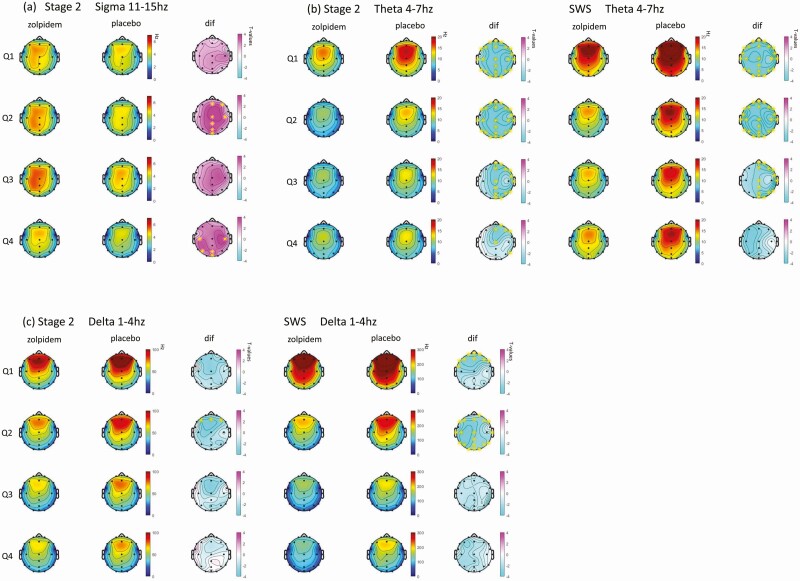
Figure 4.
Topographic plots of the estimated marginal mean difference in spectral power by 4 quartiles between zolpidem and placebo for (a) sigma frequency (11-15Hz) at stage 2; (b) theta frequency (4-7Hz) at stage 2 and SWS; (c) delta frequency (1-4Hz) at stage 2 and SWS. Q1: quartile 1; Q2: quartile 2; Q3: quartile 3; Q4: quartile 4; dif: difference in the estimated marginal mean between zolpidem and placebo. *Statistically significant at this electrode following Benjamini–Hochberg correction for multiple comparisons.

