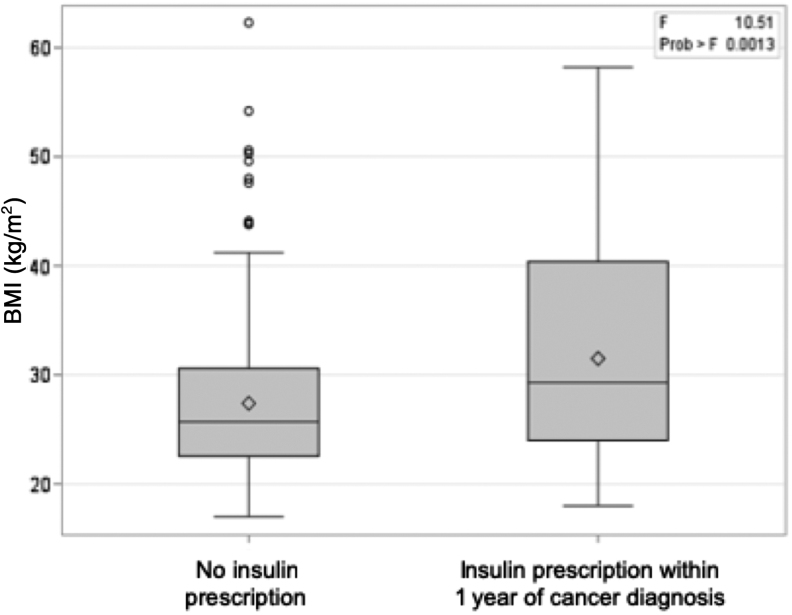
FIG. 3.
Distribution of BMI among AYAs by insulin status within 1 year of first primary invasive cancer diagnosis. The bold line within each boxplot represents the median BMI, and the upper and lower bounds of the boxplot represent the 75th and 25th percentiles, respectively. Outer edges reflect the 10th (lower) and 90th (upper) percentiles, respectively, mean BMI is denoted by the diamond, and outliers are denoted in circles. BMI, body mass index.

