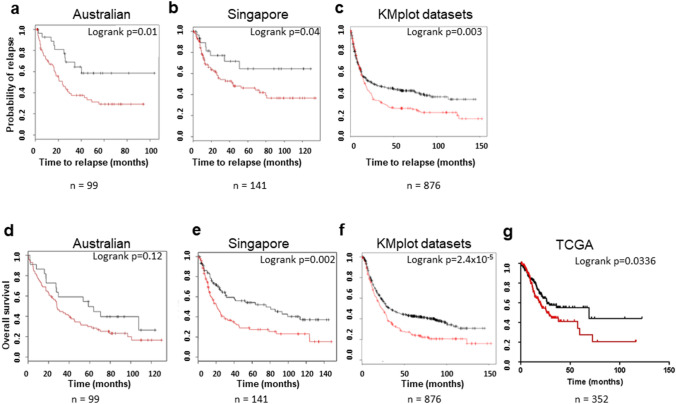
Fig. 2.
Effects of SFRP4 expression on relapse free (RFS) and overall survival (OS). Samples with available survival data were classified as SFRP4 high (red) or low (black) based on mRNA expression using the Barcode method [Australian (n = 99) and Singapore cohorts (n = 141)] or default settings of the kmplot interface (combined independent datasets (n = 876) or Survexpress for the TCGA STAD cohort (n = 352). a-c Kaplan–Meier curves were generated showing RFS. The results indicate that high SFRP4 expression levels were correlated with poor prognosis whilst patients harbouring tumours with low SFRP4 expression levels had a significantly lower risk of recurrence [p = 0.01 (Australian data set); p = 0.04 (Singapore data set); p = 0.003 (combined independent data set) log-rank test]. A similar analysis was performed using OS as an endpoint (d) Australia dataset p = 0.12 (e) Singapore dataset p = 0.002 (f) combined independent data set p = 2.4 × 10⁻⁵ (g) TCGA STAD dataset (p = 0.0336)

