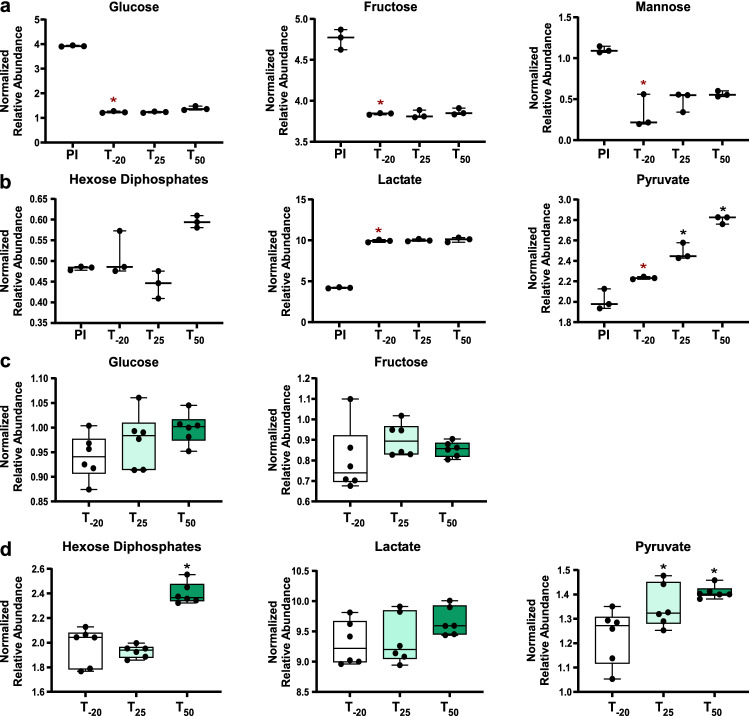
Fig. 3.
Relative abundance of carbohydrates and glycolytic intermediates in media and cells. Levels of carbohydrates in media (a) and cells (c) are depicted. Products of glycolysis in media (b) and cells (d). Whiskers indicate the range; horizontal bars represent the mean. A two-tailed t-test was used to compare the pre-inoculum (PI) media samples to post-inoculum (T-20). Red asterisks indicate P-value < 0.05. Spent media and cell metabolite levels were compared using one-way ANOVA with a Fisher’s least significant difference test to compare the post-EDTA (T25 and T50) samples to pre-EDTA (T-20). Black asterisks indicate P-value < 0.05

