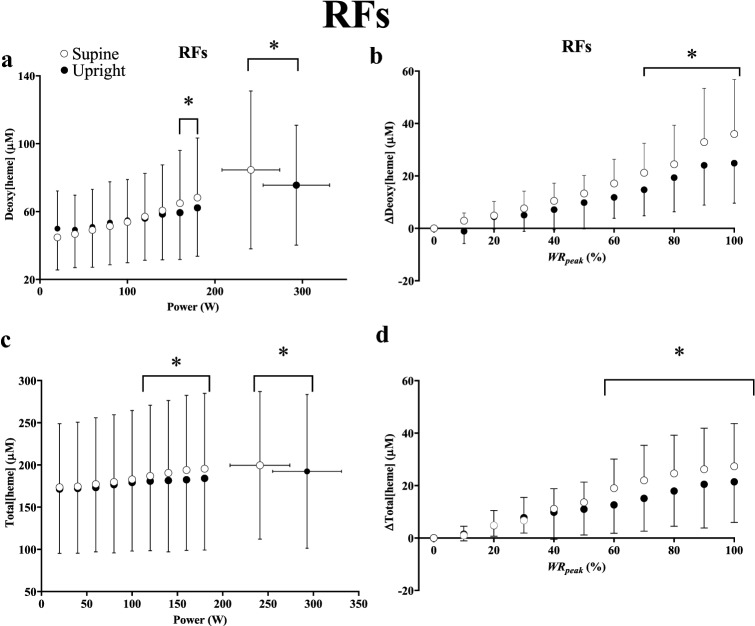
Fig. 5.
Group mean deoxy[heme] (a, b) and total[heme] (c, d) responses to ramp incremental cycle exercise as a function of both absolute power output (a, c) and as a relative change from the baseline value, plotted as a percentage of the peak work rate attained during the test (b, d) in the superficial rectus femoris (RFs). Error bars represent SD. *Significant difference between postures at the same absolute or relative work rate (P < 0.05).

