Fig. 4.
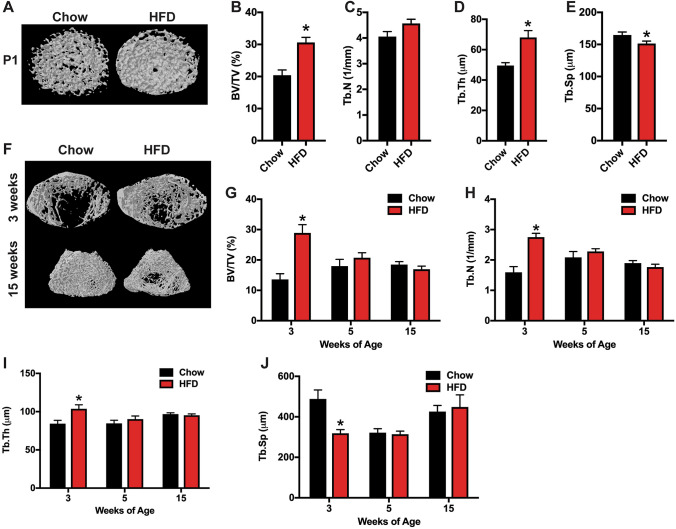
MicroCT analysis of trabecular bone in female offspring. a Representative microCT images of the distal femur at postnatal week 0 (P1) of the female offspring of dams fed a Chow or HFD. b–e Quantification of trabecular bone volume/tissue volume (b, BV/TV), trabecular number (c, Tb.N), trabecular thickness (d, Tb.Th) and trabecular separation (e, Tb.Sp) in the distal femur (n = 8–15 rats/group) at postnatal week 0. f Representative microCT images of the distal femur at postnatal week 3 and 15 of the female offspring of dams fed a Chow or HFD. g–j Quantification of trabecular bone volume/tissue volume (g, BV/TV), trabecular number (h, Tb.N), trabecular thickness (i, Tb.Th) and trabecular separation (j, Tb.Sp) in the distal femur (n = 8–14 rats/group) at postnatal weeks 3, 5 and 15. All results are expressed as mean ± SEM, *p < 0.05

