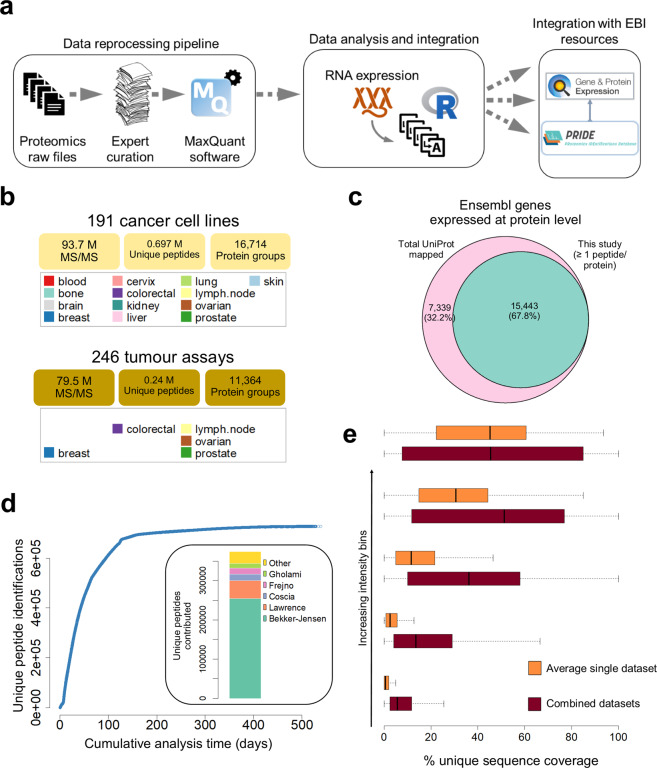
Fig. 1.
(a) Overview of the study design and the data reanalysis pipeline. (b) Summary of the total number of MS/MS spectra, number of unique peptides and protein groups identified in the cell line and tumour datasets. (c) Overlap between Ensembl protein-coding genes identified and all theoretical genes annotated in UniProt. Only protein groups identified by at least one unique peptide were included. (d) Plot showing the cumulative MS analysis time versus the cumulative number of unique peptide identifications obtained. Inset: barplot showing the proportion of peptides uniquely identified in each individual dataset. (e) Distribution of protein sequence coverage in the cell line data, stratified into bins of increasing protein intensity, in the combined dataset (brown boxplots) and an average calculated across 7 individual datasets (orange boxplots).

