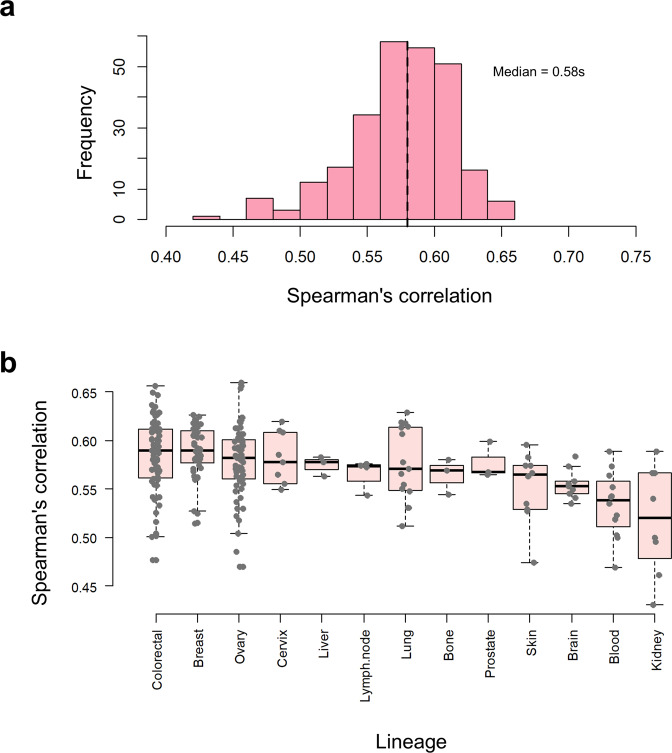
Fig. 4.
Correlation between mRNA and protein expression levels within the different cell lines. (a) Distribution of mRNA-protein Spearman correlation in 134 cancer cell lines (261 proteomics assys) originating from 13 lineages. The 134 cell lines were those common to this analysis and the existing RNA-seq data. (b) Boxplots showing the differences in distribution of mRNA-protein correlations between groups of cell lines originating from various lineages. The box plots show the median (horizontal line), interquartile range (box) and minimum to maximum values of the data. Only lineages with more than three cell lines were included.

