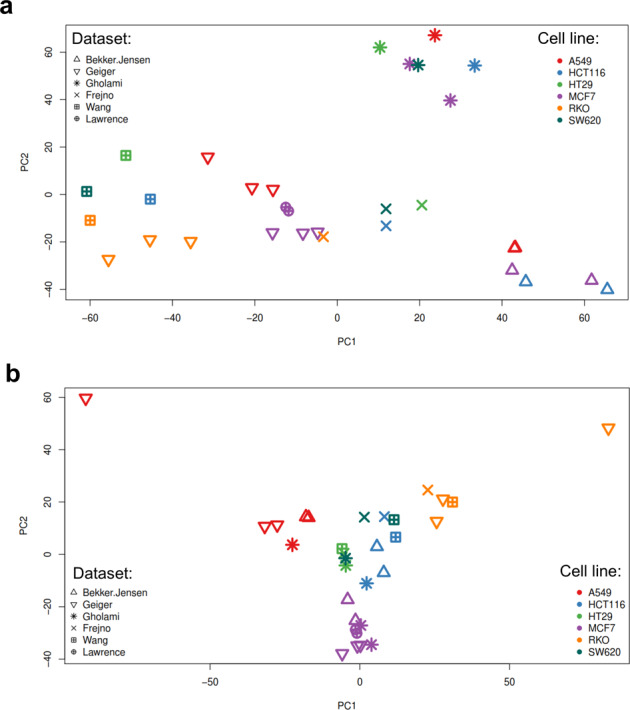
Fig. 7.

Principal component analysis. A complete matrix across six cell lines (A549, HCT116, HT29, MCF7, RKO and SW620) was used for PCA analysis. This included 2,914 protein expression values. The first two principal components explaining 35% and 30% of the variance are displayed. The colour of the points indicates the sample types whereas the shape of the point indicates the corresponding study. Panel a) shows the PCA space after “ppb” normalisation. It can be observed that points (individual samples) cluster according to the study of origin. Panel b) shows the PCA space after limma batch effects removal. It can be observed that cell lines cluster together based on the lineage rather than based on the study of origin.
