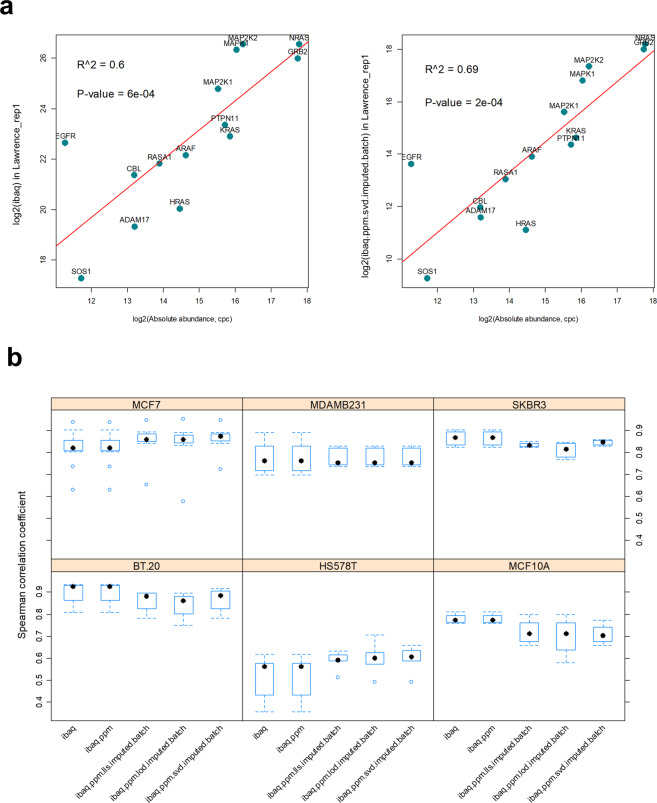
Fig. 8.
Validation of the normalization procedure by comparison to absolute protein abundances in six cell lines. Panel (a) Examplary relationship between estimated absolute protein abundances in copies per cell (cpc) and ibaq or ibaq.ppm.svd.imputed.batch quantification values in the MCF7 cell line. Panel (b) Distributions of the calculated Spearman’s rank correlation coefficients between absolute protein abundances and quantification values based on various normalization and missing data imputation methods.

