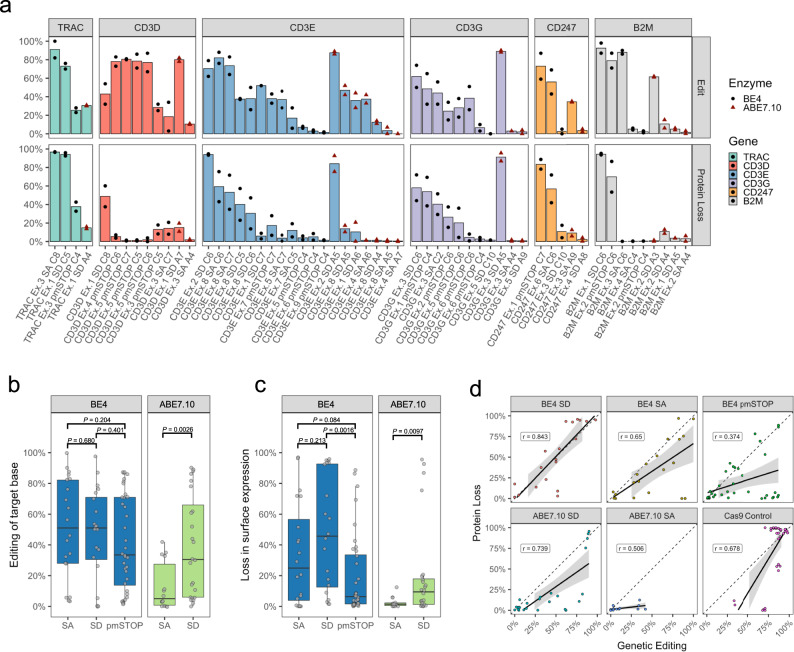
Fig. 3. BE-splice sgRNAs mediate robust editing and disruption of TCR-CD3 MHC Class I immune synapse.
a Editing efficiency (top) and surface protein loss (bottom) from each guide in the sgRNA screen. Results grouped by gene and enzyme used in descending order by protein loss. X-axis label indicates position of target base within sgRNA. TRBC1 and TRBC2 were omitted from the BE-splice screen due to the inability to design single BE-splice sgRNAs to target both paralogs simultaneously. All edits represent the efficiency of target editing; C:G-to-T:A for CBE, and A:T-to-G:C for ABE. Height of bars are mean of replicates. b, c Base editing efficiencies or protein loss efficiencies grouped by enzyme and target motif. Data analyzed with Student’s two-tailed t-test if variance was equal, or Welch’s two-tailed t-test if variance was unequal with exact P-values shown. Boxplot center lines represent the median, box limits represent the upper and lower quartiles, and whiskers define the 1.5× interquartile range. d Consistency of editing efficiency and protein loss across all approaches employed here. Relationship between protein loss and base editing efficiency is comparable to that observed in Cas9 control. Error bands represent 95% CI of the mean. All data is from N = 2 independent donors, performed on different days. Source data are available in the Source Data file.

