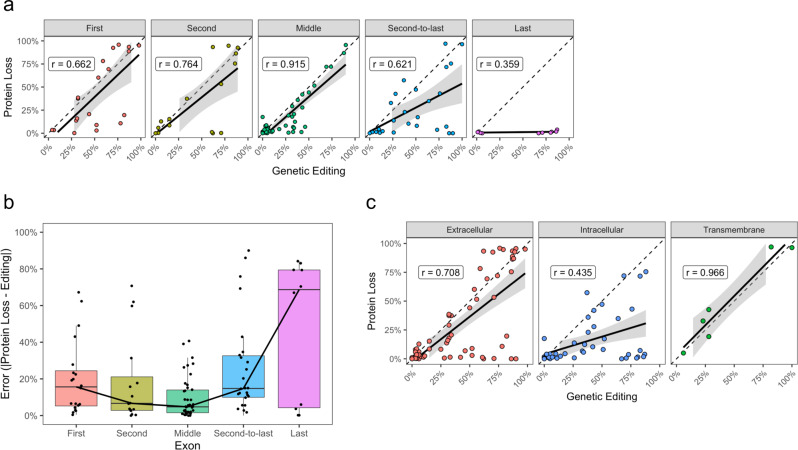
Fig. 5. Consistency of editing efficiency and protein loss across mRNA and protein regions.
a Scatter plots of protein loss and editing efficiency by exon grouping across all base editor approaches employed. The strongest relationship is observed among middle exons, while the weakest is observed in the last exon. Pearson’s correlation coefficient (r) is shown. Error bands represent 95% CI of the mean. b Error in protein loss as a function of editing efficiency across each exon group. Boxplot center lines represent the median, box limits represent the upper and lower quartiles, and whiskers define the 1.5× interquartile range. The least error is observed among middle exons, while the greatest is observed in the last exon. N = 57 unique enzyme-guide combinations with two independent donors. c Scatter plots of the protein loss and editing efficiency grouped by where each BE sgRNA maps to the TCR-CD3 and MHC Class I structures. sgRNAs that map to transmembrane and extracellular regions exhibit the greatest consistency between protein loss and base editing efficiency. Pearson’s correlation coefficient (r) is shown. Error bands represent 95% CI of the mean. Source data are available in the Source Data file.

