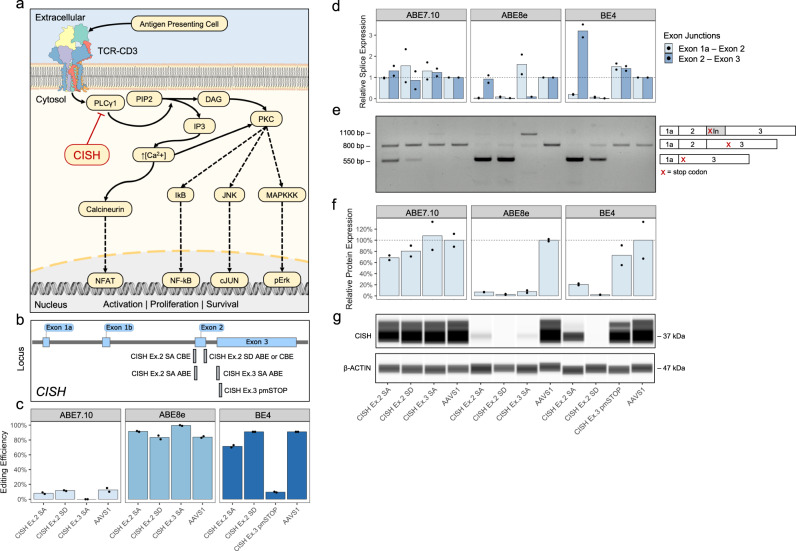
Fig. 6. Using ABEs and CBEs to disrupt the intracellular protein CISH in the K562 cell line.
a Diagram of CISH immunohibitory pathway. b Mapping of sgRNAs to CISH locus. c Editing efficiencies with sgRNAs paired with ABE7.10, ABE8e, and BE4. AAVS1 is an inert locus control. d Taqman expression assays of CISH exon boundaries. Data normalized to AAVS1 control. N = 2 biological replicates, each with 3 technical replicates. e Representative gel image of whole-cDNA amplification of edited samples with altered isoforms from two independent biological replicates. See Supplementary Fig. 15 for uncropped gel image. f Relative protein expression quantified from digital western blot of CISH. CISH expression normalized within-samples to β-ACTIN and between-samples to AAVS1 control. Height of bars represents mean of N = 2 biological replicates. g Representative digital western blot of CISH and β-ACTIN from two independent biological replicates. See Supplementary Fig. 17 for uncropped western blot images. Source data are available in the Source Data file.

