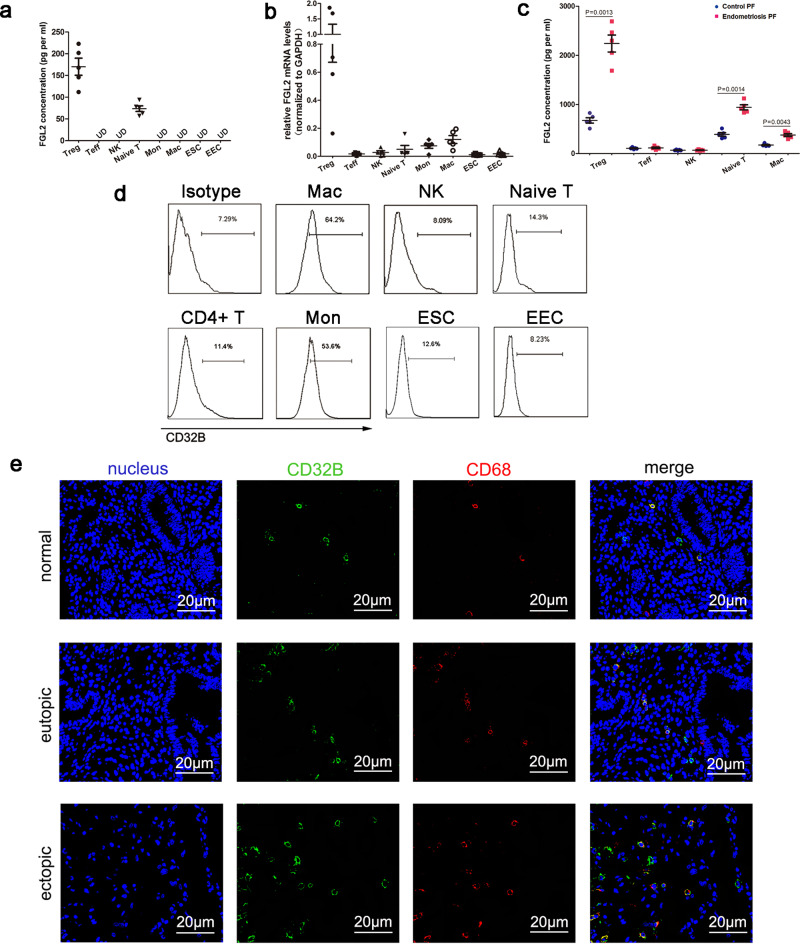
Fig. 2. The expression of FGL2 and CD32B on isolated cells and in tissues.
a ELISA for FGL2 concentrations in cell culture supernatant. b FGL2 mRNA expression levels in different kinds of cells. (a, b) The individual immune cell populations were isolated from PBMC. EECs and ESCs from endometrium were primary cultured. c ELISA for FGL2 concentrations in cell culture supernatant. The individual immune cell populations were isolated from the peritoneal fluid of women with or without endometriosis (PF: peritoneal fluid). d CD32B expression on cell surfaces was measured by FCM. e Confocal microscopic analysis of nucleus (blue), CD32B (green), CD68 (red), expression in normal endometrium, eutopic endometrium, and ectopic lesions. Data represent the mean value ± SEM.

