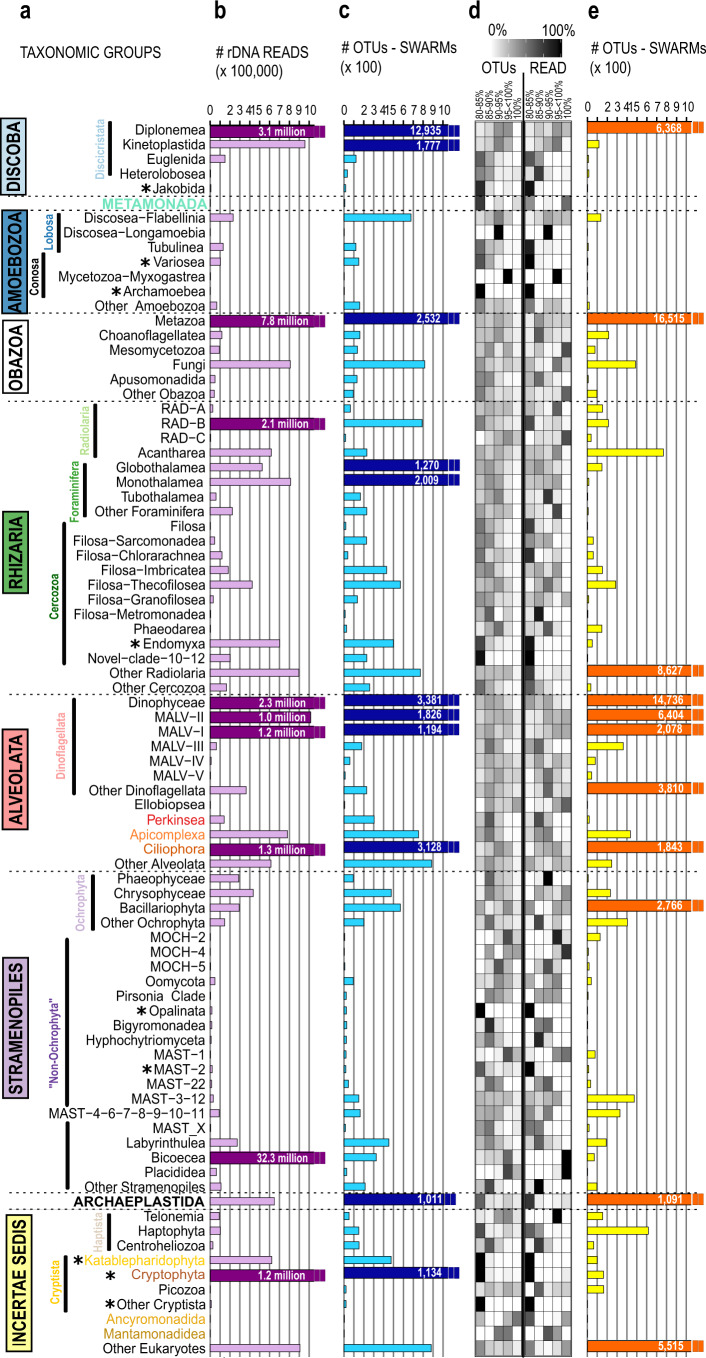
Fig. 2. Taxonomic partitioning of the total assignable eukaryotic ribosomal diversity (V9 SSU rDNA) from the deep-sea and Tara Oceans11 datasets.
a Deep-branching eukaryotic taxonomic groups observed in the deep sea. Taxonomic groups include supergroups (see also Fig. 1), division (see also Fig. 3), and class/order (this figure) level as given in the PR2 database classification. Taxonomic groups, which are used in Fig. 1 (supergroups) and Fig. 3 (divisions), are colored. Asterisks indicate that >90% of reads within this lineage had a 80–85% sequence similarity to reference sequences. b Deep-sea eukaryotes abundance expressed as numbers of rDNA reads. Scaling of axis ranges from 0 to 1 million reads. Taxonomic groups with more than 1 million reads exceed the axis and are indicated with dark-purple bars and the number of reads is written within the bars (nine most abundant lineages with >1 million reads). c Deep-sea eukaryotes’ richness expressed as numbers of OTUs. Scaling of axis ranges from 0 to 1000 OTUs. Taxonomic groups containing >1000 OTUs exceed the axis and are indicated with dark-blue bars and the number of OTUs is written within the bars (11 hyperdiverse lineages containing >1000 OTUs). d Percentage of rDNA reads and OTUs (calculated within each taxonomic group itself) with various ranges of sequence similarity (80–85%, 85–90%, 90–95%, 95–<100%, and 100%) to reference sequences. e Sunlit ocean eukaryotic richness expressed as number of OTUs from the Tara Oceans global metabarcoding dataset. Taxonomic groups containing >1000 OTUs exceed the axis and are indicated with red bars and the number of OTUs is written within the bars.

