Figure 3.
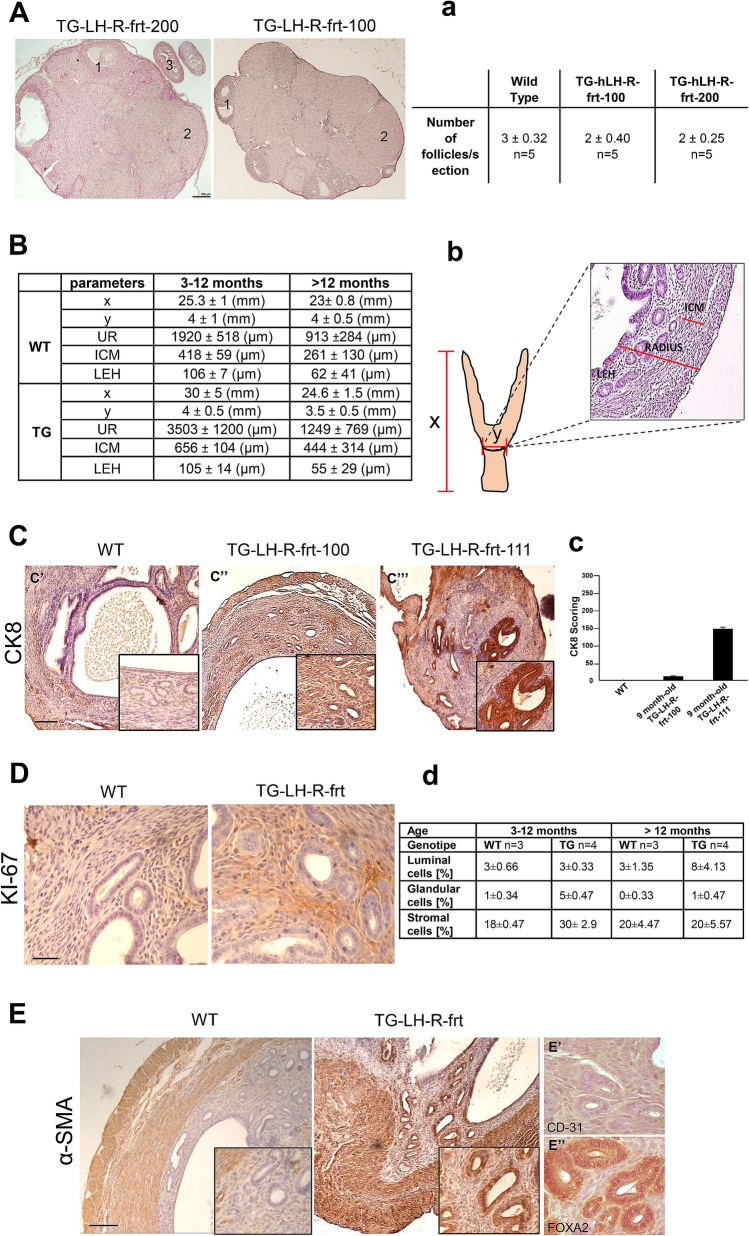
Characterization of the ovaries and uteri of transgenic mice. (A): H&E staining on representative ovary samples of TG-LHR-frt-200 mouse (left panel) and TG-LHR-frt-100 mouse (right panel). The ovaries do not show any histological alterations: antral follicles (1), corpus luteum (2) and the oviduct (3) are indeed still visible. Bar = 100 μm. (a): Resuming table in which the mean number ± SEM of antral and atretic follicles observed in each ovary slide is reported. We evaluated 5 mice per group (n = 5), 5 slides per mouse. (B): Table summarizing the characterization of the uteri of TG and WT mice in terms of size (x and y axes) and morphometry parameters (UR, ICM and LEH). Mice 3-12 months old: UR: TG vs WT p = 0.43; ICM: TG vs WT p = 0.21; LEH: TG vs WT p = 0.96. Mice > 12 months old: UR: TG vs WT p = 0.72; ICM: TG vs WT p = 0.64; LEH: TG vs WT p = 0.87. Values are shown as mean ± SEM. (b): The uterus longitudinal axis (x) and the transversal axis (y) of TG (of both the TG lines) and WT mice are reported. In the box a detail of a representative H&E staining showing UR, ICM and LEH is reported. (C): Representative IHC pictures of the uteri of WT and transgenic mice labelled with CK-8: (C’): 13 months-old WT mouse negative to cytokeratin 8; (C’’): 9 months-old TG-LH-R-frt-100, weakly positive; (C’’’): 9 month-old TG-LH-R-frt-111 (belonging to the TG-LH-R-frt-100 line) strongly positive to CK-8. Nuclei are counterstained with hematoxylin. Bar = 200 μm (c): Histogram summarizing CK-8 scoring in the different uteri samples (WT, TG-LH-R-frt-100 and TG-LH-R-frt-111). Sample size: 6 mice per group. (D): Representative IHC pictures of the uteri of WT and transgenic mice labelled with anti Ki67 antibody. Left panel: WT mouse. Right panel: TG-LH-R-frt mouse. Nuclei are counterstained with hematoxylin. Bar = 200 μm (d): Table summarizing Ki67 scoring in the different samples. The mean percentage of labeled nuclei evaluated in three different areas is reported. Mice are divided into two groups of age: 3-12 months old and older than 12 months. Statistically significant differences are observed between WT vs TG animals in glandular cells (TG vs WT p = 0.008, Fisher’s exact test) and stromal cells (TG vs WT p = 0.015, Fisher’s exact test) of 3-12 months-old mice. Sample size: 8 TG-LH-R-frt mice, 6 WT. 4 TG and 3 WT mice for each group of age. (E): Representative IHC pictures of the uteri of WT and TG mice labelled with anti α-sma antibody. Left panel: WT mouse. Right panel: TG-LH-R-frt mouse (of both the TG lines). (E’): Uterine slice of TG-LH-R-frt mouse stained with CD31 antibody: the staining is not present in the gland. (E’’): Uterine slice of TG-LH-R-frt mouse stained with FOXA2 antibody: only the glands are positive. Nuclei are counterstained with hematoxylin. Bar = 200 μm.

