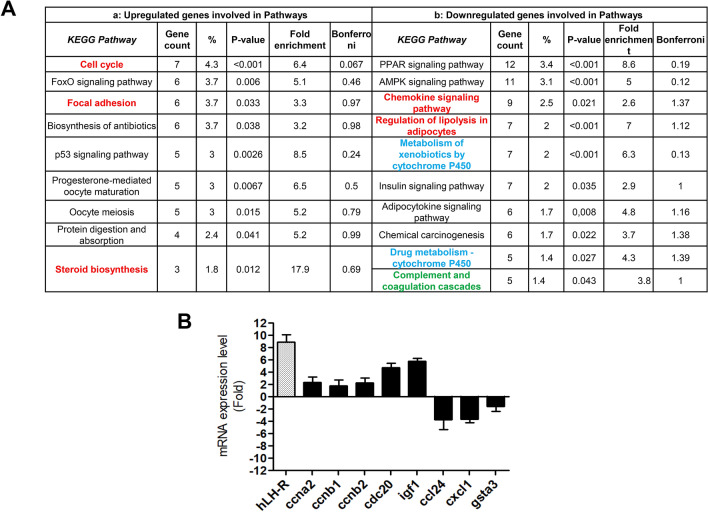
Figure 4.
A: Pathways enrichment analysis of upregulated (a) and downregulated (b) genes, using p-values < 0.05 as threshold. The transcriptomic analysis was performed on uteri of two 6-months old TG mice (belonging to the TG-hLH-R-frt-200 mouse line) and WT mice. Table shows the number and the percentage of genes involved in each pathway, with the relative fold enrichment. For this analysis the Bonferroni correction was applied. (B): Bar-graph of the mRNA fold increase of 8 genes (excluding hLH-R) showing alterations between TG and WT mice in the microarray data. Data are reported as log2 of 2-DDCt. The Log2 fold change values from microarray data and Log2 fold change values from RQ-PCR data are used to perform Pearson Correlation Test. p = 0.0032 (two-tailed t-test; n = 4, 2 WT vs 2 TG). R square = 0.85 (Pearson correlation coefficient).

