Figure 5.
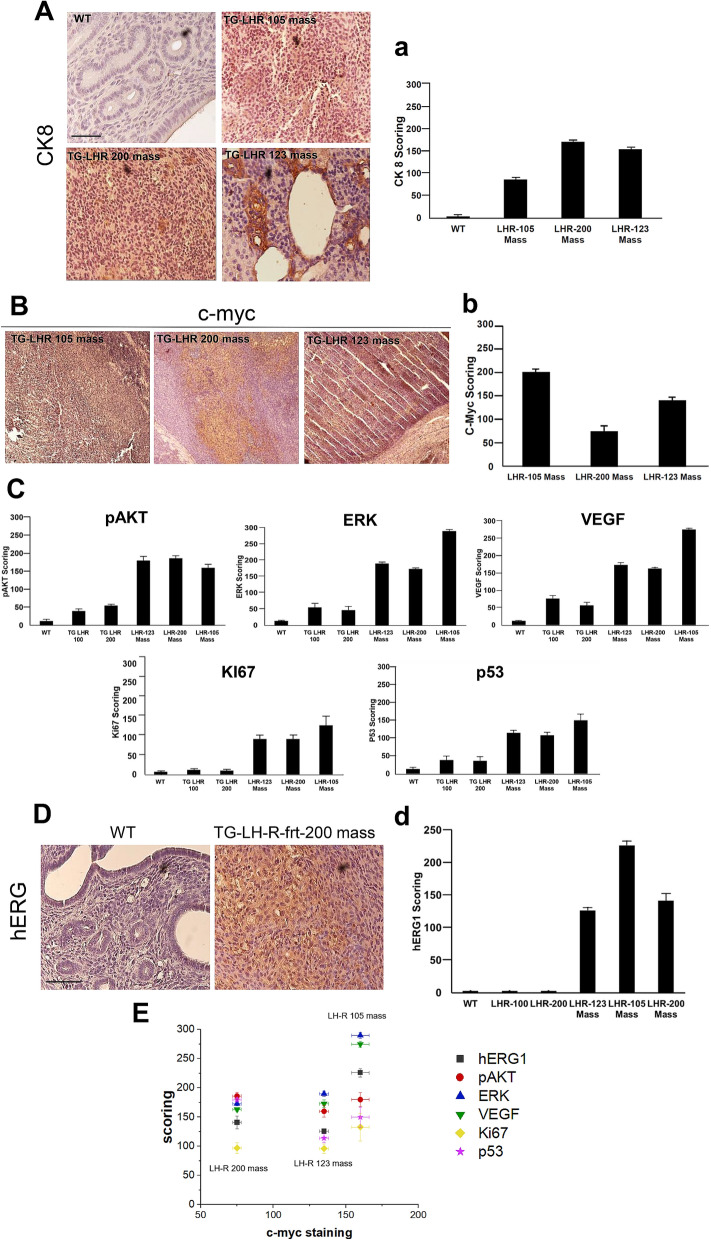
Pathological findings in aged female transgenic mice. A: IHC staining with anti-CK-8 antibody on masses derived from TG-LH-R-frt-105, TG-LH-R-frt-200 and TG-LH-R-frt-123. Nuclei are counterstained with hematoxylin. Bar = 200 μm a: histogram summarizing CK-8 scoring in the different tumor masses (TG-LH-R-frt-105 mass: 86 ± 4.5; TG-LH-R-frt-200 mass: 172 ± 4.4 and TG-LH-R-frt-123 mass: 155 ± 3; WT score = 0). B: Representative IHC pictures of masses derived from TG-LH-R-frt-105, TG-LH-R-frt-200 and TG-LH-R-frt-123 labelled with anti-c-myc antibody. Nuclei are counterstained with hematoxylin. b: Histogram summarizing c-myc scoring in the different tumor masses (TG-LH-R-frt-105, TG-LH-R-frt-200: 75 ± 3, TG-LH-R-frt-123: 105:160 ± 6). C: histograms summarizing pAKT. ERK, VEGF, Ki67 and p53 scoring in the different tumors (pAKT: WT: 12 ± 5; healthy TG-LH-R-frt-100 40 ± 7; healthy TG-LH-R-frt-200 55 ± 5; TG-LH-R-frt-123 mass: 160 ± 17.3; TG-LH-R-frt-200 mass: 186 ± 6.6; TG-LH-R-frt-105 mass: 180 ± 11.5. ERK: WT: 13 ± 2; healthy TG-LH-R-frt-100: 55 ± 13; healthy TG-LH-R-frt-200: 46 ± 12; TG-LH-R-frt-123 mass: 190 ± 5; TG-LH-R-frt-200 mass: 173 ± 3.5; TG-LH-R-frt-105 mass: 290 ± 5. VEGF: WT: 11 ± 1, healthy TG-LH-R-frt-100: 77 ± 9, healthy TG-LH-R-frt-200: 57 ± 8.8, TG-LH-R-frt-123 mass: 173 ± 7, TG-LH-R-frt-200 mass: 163 ± 3; TG-LH-R-frt-105 mass: 275 ± 5. Ki67: WT: 8 ± 1.5, healthy TG-LH-R-frt-100: 13 ± 3.7, healthy TG-LH-R-frt-200: 11 ± 3.8, TG-LH-R-frt-123 mass: 96.6 ± 9, TG-LH-R-frt-200 mass: 96.6 ± 9; TG-LH-R-frt-105 mass: 133 ± 24. P53: WT: 13 ± 4, healthy TG-LH-R-frt-100: 35 ± 10, healthy TG-LH-R-frt-200: 33 ± 11, TG-LH-R-frt-123 mass: 115 ± 7.5, TG-LH-R-frt-200 mass: 108 ± 7.5; TG-LH-R-frt-105 mass: 150 ± 17.3). D: Representative IHC picture using image anti-hERG1 antibody on the uterus of WT mouse and the mass derived from TG-LH-R-frt-200. The expression of hERG1 and c-myc is evaluated in adjacent tumor sections. Nuclei are counterstained with hematoxylin. Bar = 200 μm. d: Histogram summarizing hERG1 score quantification in the different samples (WT: 0, healthy TG-LH-R-frt-100 mice: 0, healthy TG-LH-R-frt-200 mice: 0, TG-LH-R-frt-123 mass: 226 ± 7, TG-LH-R-frt-105 mass: 141 ± 11 and TG-LH-R-frt-200 mass: 126 ± 5). E: Scatter plot of hERG1, pAKT, ERK and VEGF in the three different masses. Values are means ±SEM. c-myc vs hERG1: p = 0.014, R=0.8991; c-myc vs pAKT: p = 0.013, R = 0.9048; c-myc vs ERK: p = 0.0017, R = 0.9661; c-myc vs VEGF: p = 0.005, R = 0.9431; c-myc vs Ki67: p = 0.007, R = 0.9275; c-myc vs p53: p = 0.002, R = 0.9624 (p-values are evaluated by Student’s t test; R = Pearson Correlation Coefficient).

