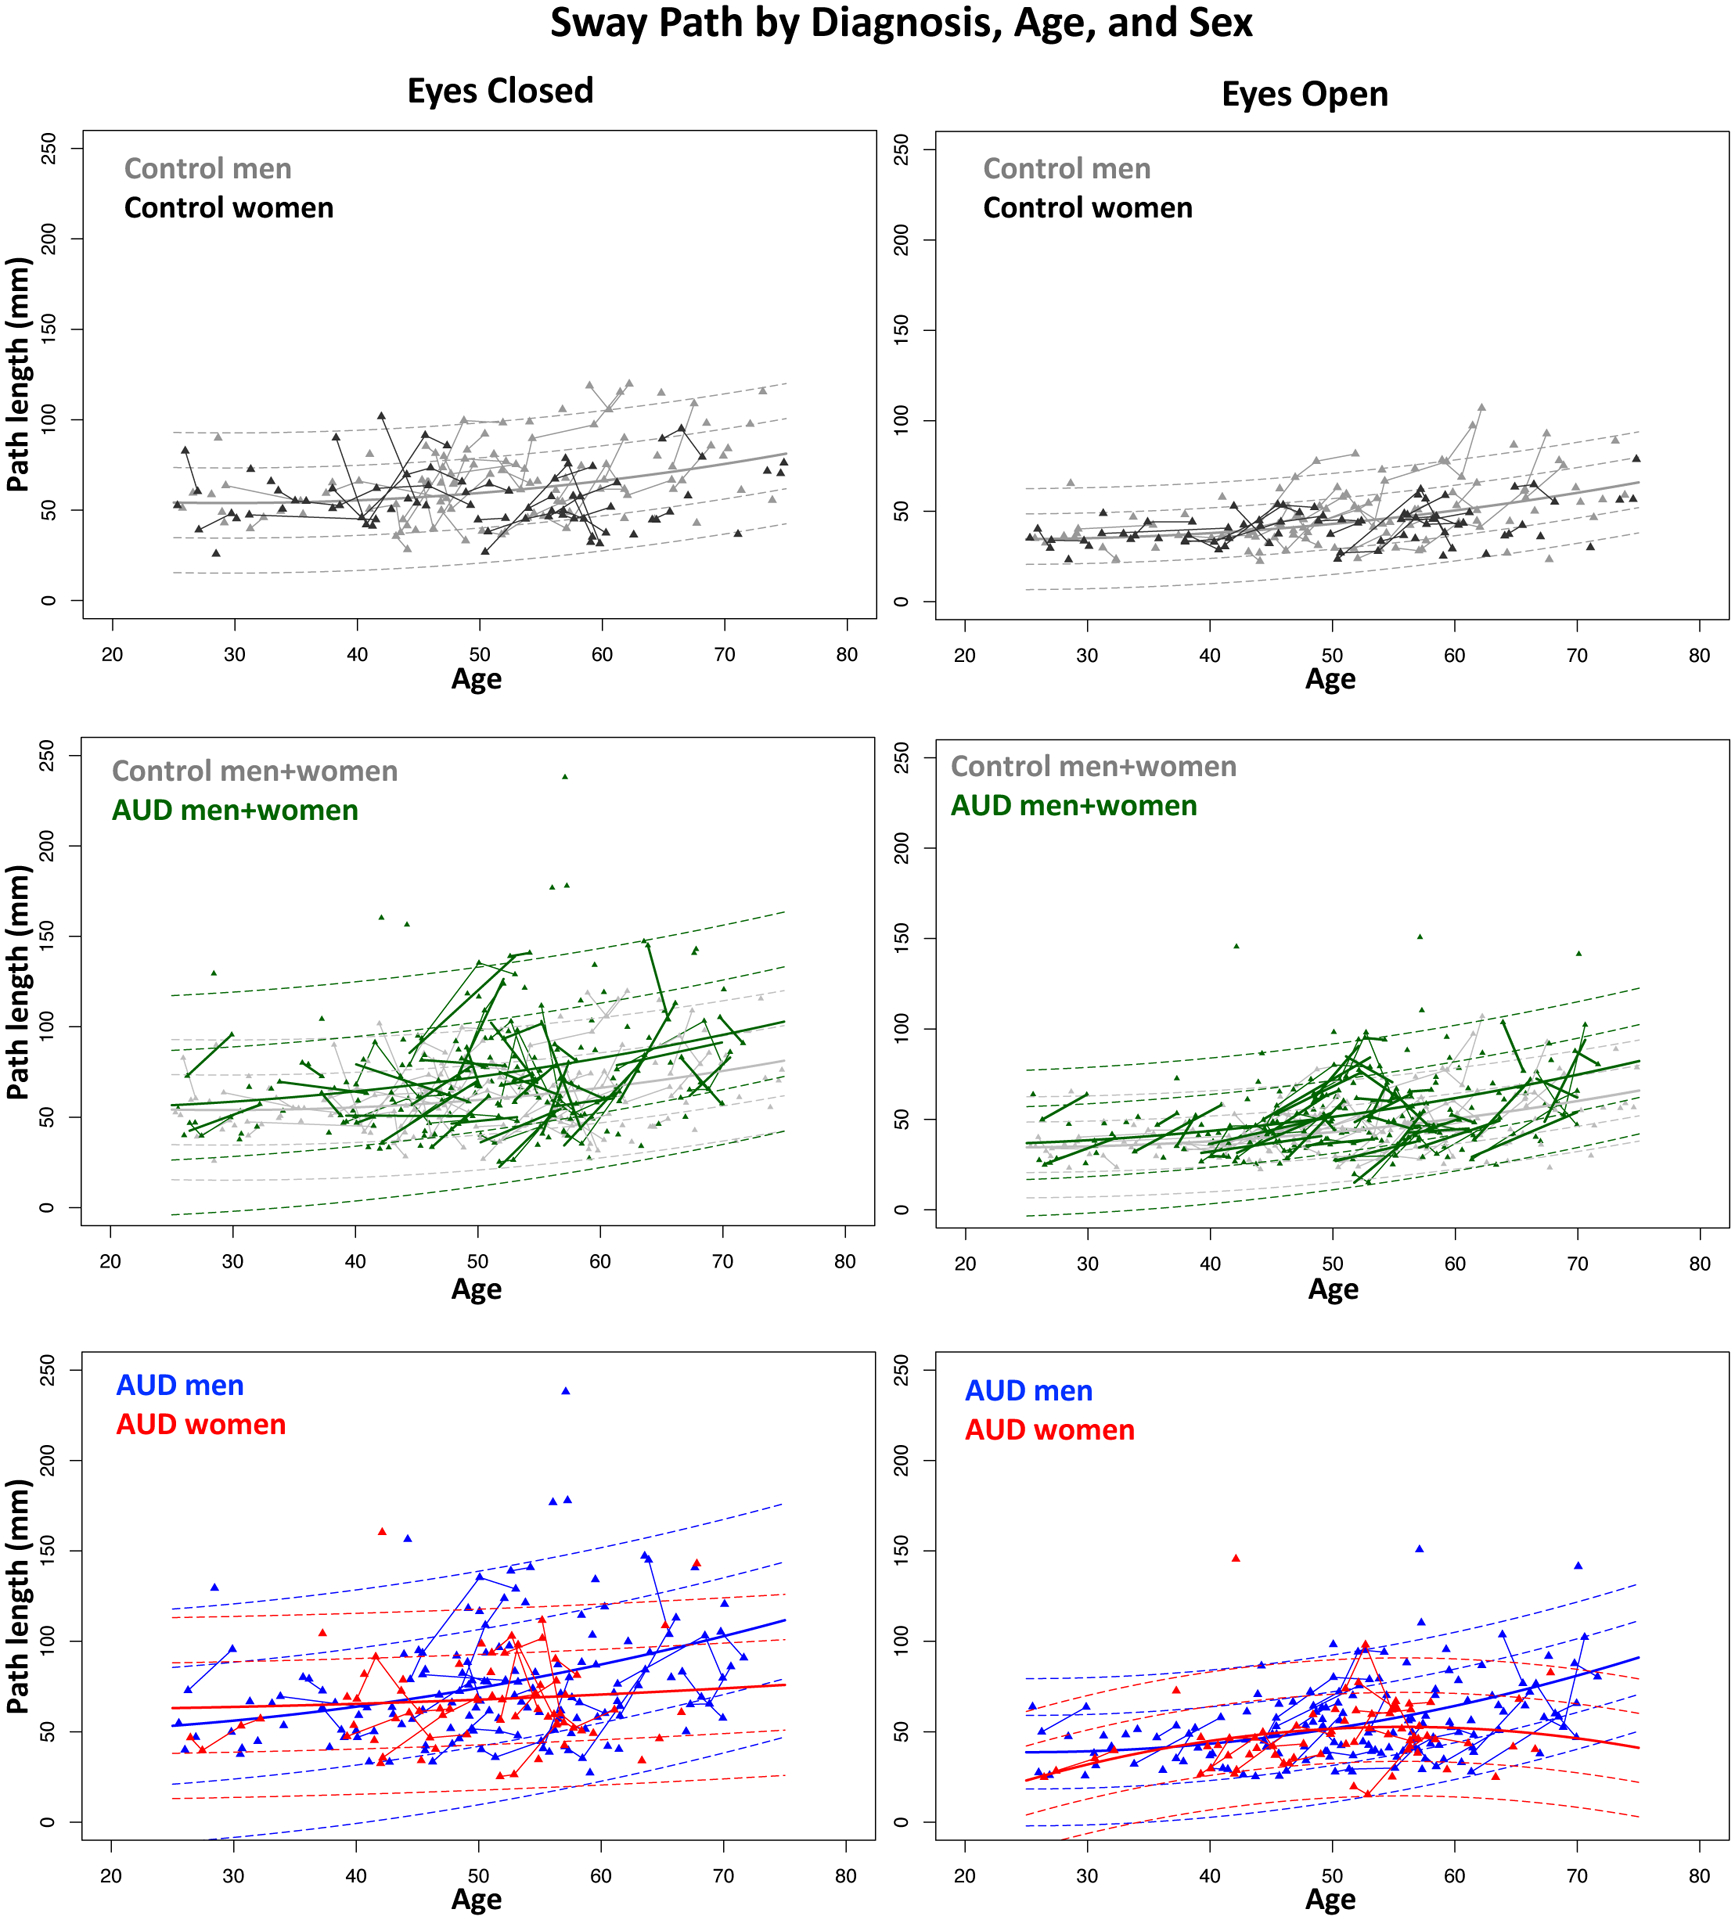
Figure 2.

Scatterplots of the mean sway path length of each participant (triangles) at each test session; longitudinal session triangles are connected with lines. Individual AUD trajectories are drawn in thick lines in the middle two panels. The mean regression over age is the solid line; ±1 and ±2 standard deviations are plotted as dashed lines. All values are color coded by diagnosis and sex. The general trend is for longer sway paths to be associated with older ages.
