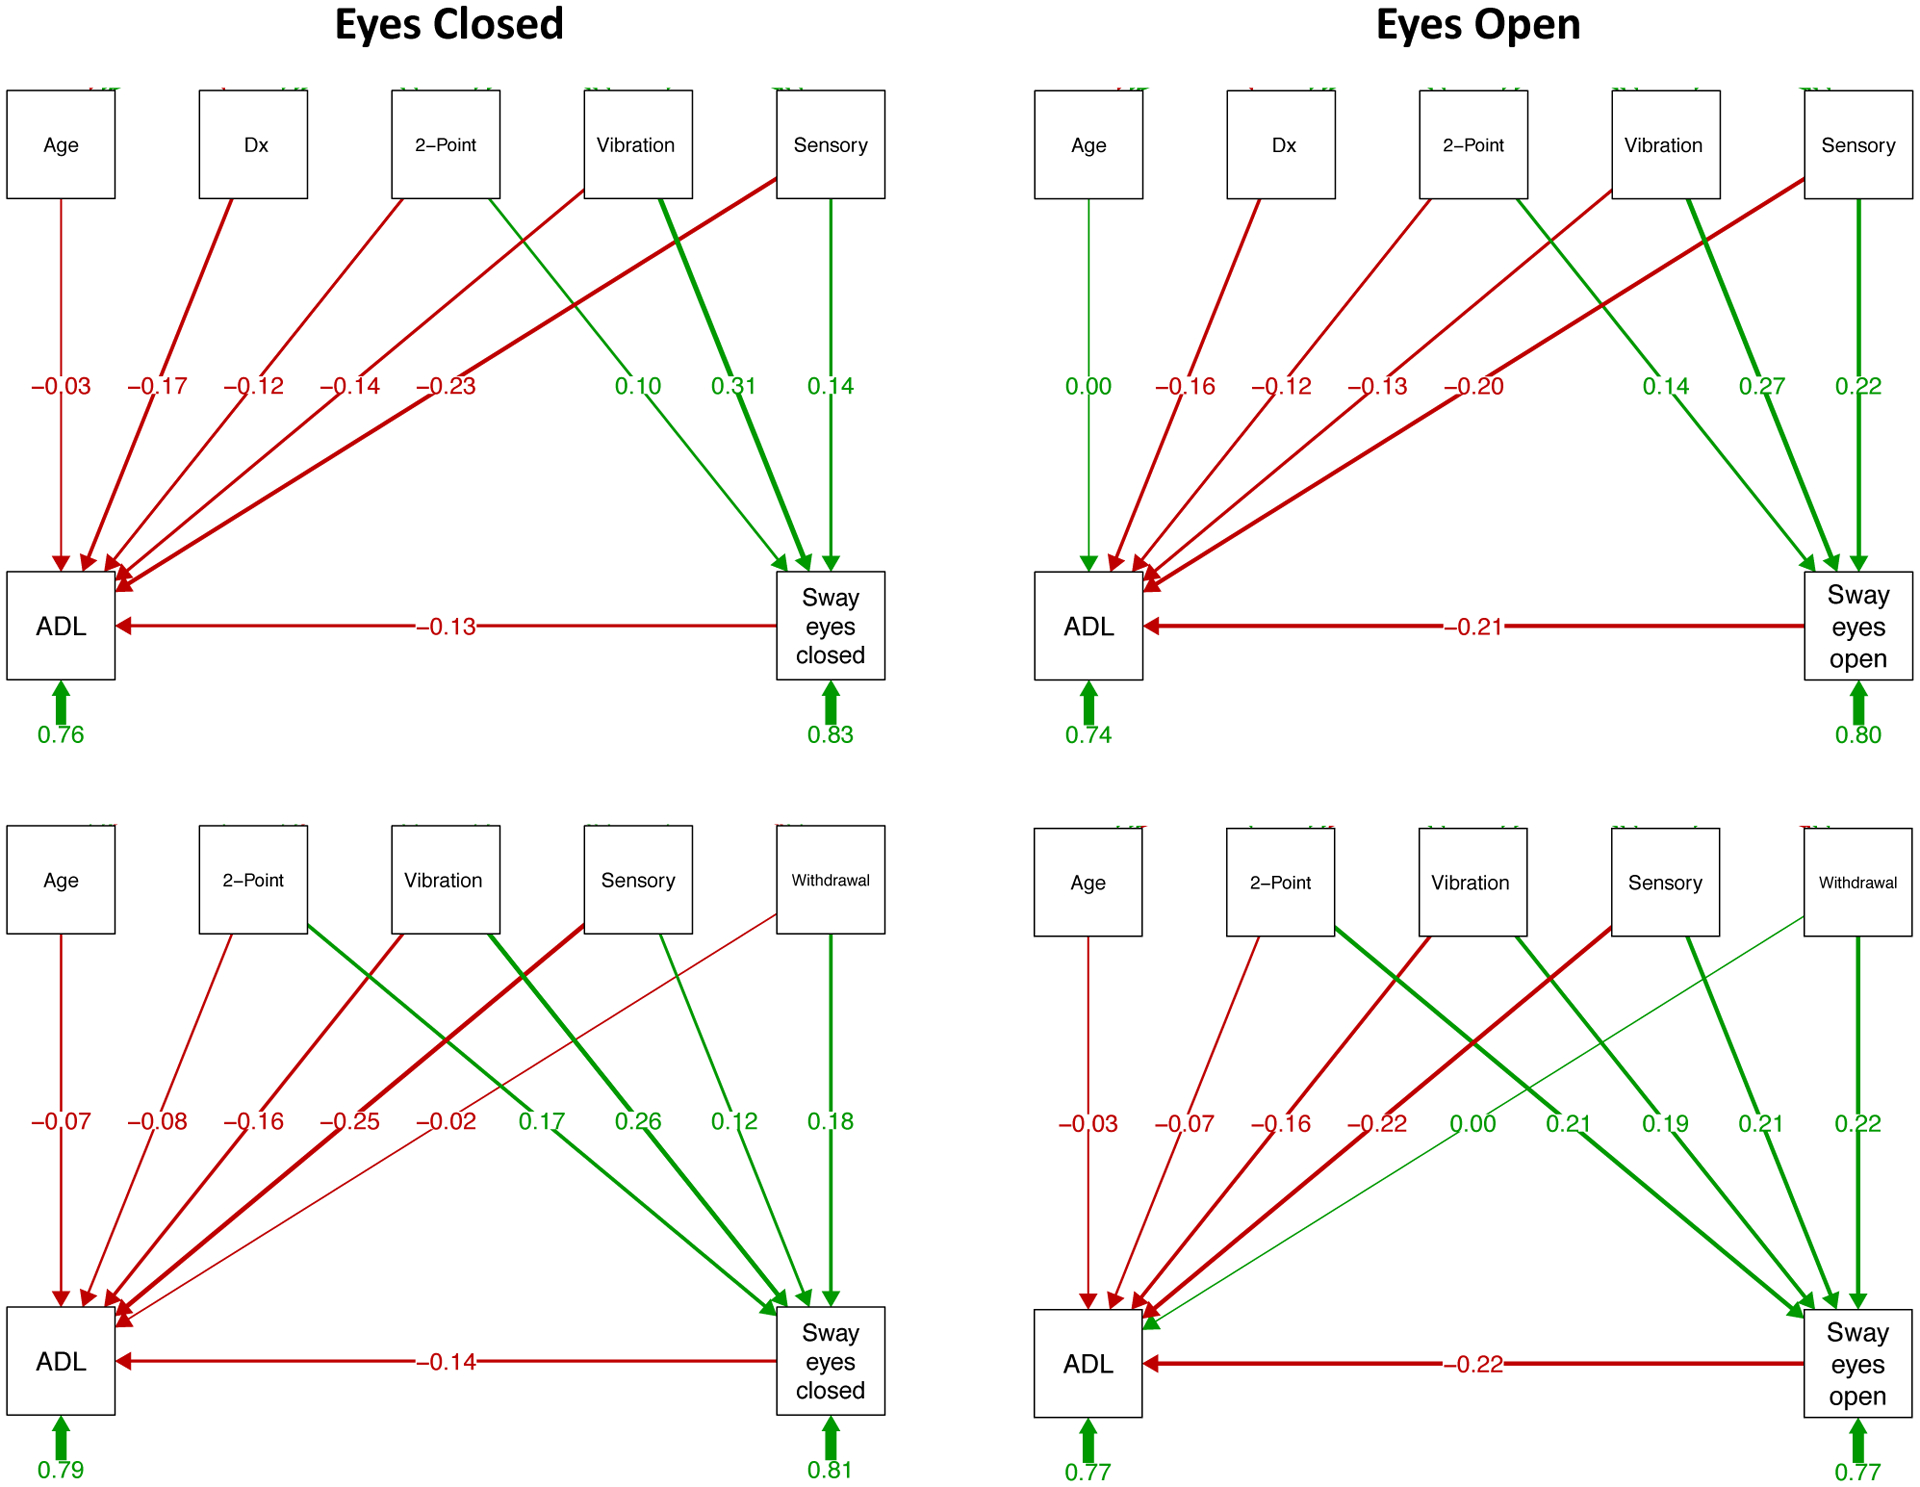
Figure 3.

Prediction of ADL and sway paths: Structural equation path analyses based on testing with eyes closed (left panels) and eyes open (right panels). The top two sets of paths include diagnosis (Dx) as a predictor, and the bottom two sets examine relations within the AUD group only and include the alcohol withdrawal index, which is meaningful for the AUD group, as a predictor. The variables in the top boxes of each path analysis are predictors of the dependent measures in the bottom boxes; the number under each short green arrow under the bottom boxes refers to the “completely standardized solution,” which includes variance associated with latent and observed variables. The long green lines with arrows and numbers represent positive correlations or path predictions, and red ones represent negative correlations or path predictions; the thicker the line connecting a predictor and outcome measure, the stronger the relation. For example, moderate to strong predictors of ADL are subjective ratings of sensory symptoms of peripheral neuropathy (“Sensory”) regardless of vision and sway path with eyes open; vibration sense and 2-point discrimination on the soles of the feet are contributors of sway path length. See Supplemental Table 1 for statistical test output.
