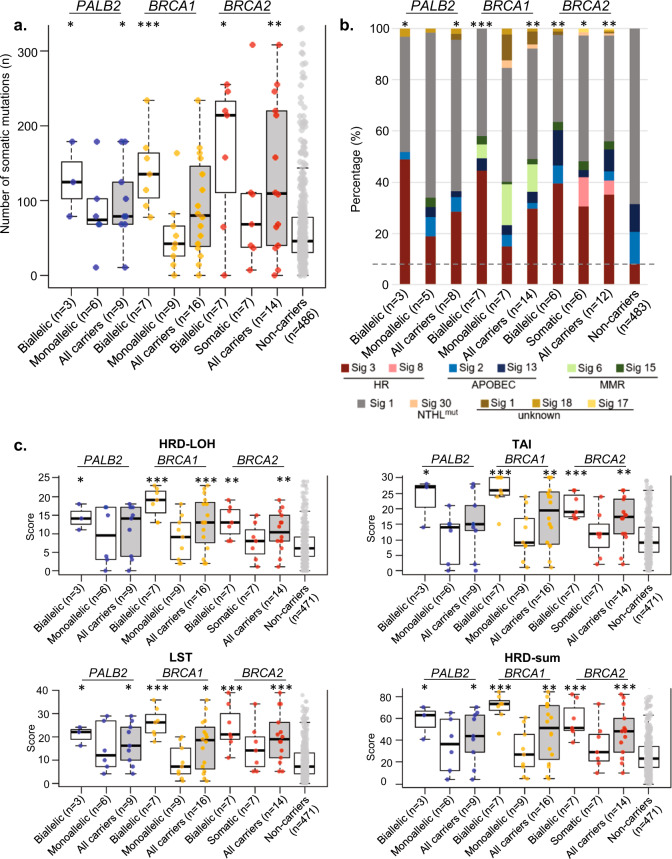
Fig. 4. Comparison of mutational profiles of tumours (with integrated germline and somatic alterations) that arise from mutation carriers of PALB2, BRCA1 and BRCA2 and non-carriers, stratified by allelic status of tumours.
a Total number of somatic alterations (single nucleotide variants (SNVs)) and indels identified in tumours with PTVs. b The stacked bar plot shows the proportion of major mutational signature in aggregate for each category. The horizontal grey dashed line indicates the proportion of mutational signature 3 in tumours that arise from non-carriers as reference for comparison. Only samples with at least 15 SNVs were included in this analysis. c Comparison of genomic scar scores for tumours with PTVs and tumours without any alterations (non-carrier group). All samples were included in this analysis except those with no Sequenza files due to unavailability of either WES germline or tumour data. Boxplots represent medians (centre line) and interquartile range, and whiskers represent the maximum and minimum values within 1.5 times the interquartile range from the edge of the box. Each data point represents an individual sample. P values: Comparison of each category vs non-carrier. ***p < 0.001; **p < 0.01; *p < 0.05; Mann–Whitney U test (a, c); Chi-square test (b).

