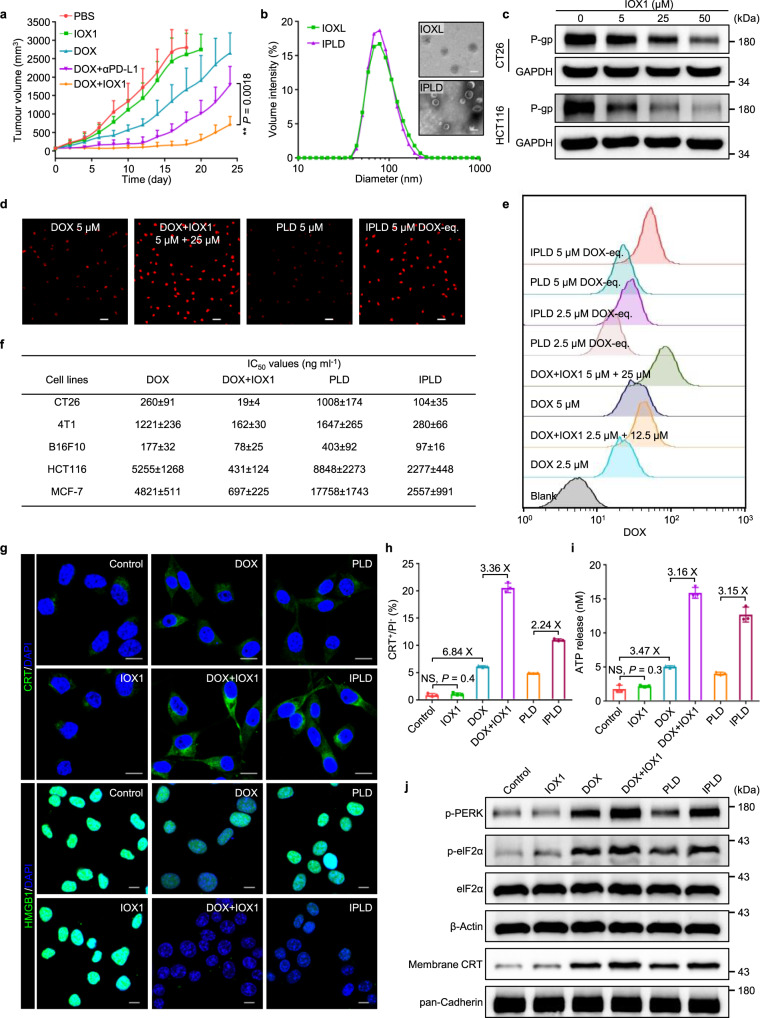
Fig. 2. IOX1 liposome formulation, inhibiting drug resistance, and potentiating cytotoxicity and ICD induction.
a Tumour growth curves of s.c. CT26 tumours in BALB/c mice treated via the tail vein injection of IOX1 (7.5 mg kg−1), DOX (5 mg kg−1), their combination (IOX1 + DOX) or DOX + αPD-L1 (DOX, 5 mg kg−1, i.v.; αPD-L1,7.5 mg kg−1, i.p.) on an every-two-day schedule for three times; initial tumour volume, 80 mm3; n = 6 mice. b Size distribution and morphology of liposomal IOX1 (IOXL) and IPLD (the mixed IOXL and PLD at an IOX1/DOX molar ratio of 5: 1) characterised by DLS and TEM; scale bars, 100 nm for the inset TEM images; n = 3 independent samples. c Western blotting images of P-gp in CT26 and HCT116 cells treated with IOX1 (5, 25, and 50 μM) for 24 h. d,e Intracellular DOX concentration analysis by (d) the fluorescence images and (e) flow cytometry analysis of CT26 cells treated with DOX or its combination with IOX1 or their liposomes for 4 h; red: DOX; scale bars, 50 μm. f The IC50 values of DOX, its combination with IOX1, or their liposomes against tumour cells; 48 h incubation; the IOX1/DOX molar ratio was kept at 5: 1; see Supplementary Fig. 16 for the dose-responsive curves. g–j ICD induction in CT26 cells treated with IOX1 or its combinations: (g) CLSM images of the CRT exposure (green) and the nuclear HMGB1 (green); blue: DAPI; scale bars, 10 μm; (h) flow cytometric analysis of CRT-positive cells (gated on the propidium iodide negative cells (PI-)) and (i) ATP secreted into the medium; n = 3 independent experiments; (j) Western blotting images of p-PERK, p-eIF2α and membrane CRT; Cells were treated with IOX1 (25 μM), DOX (5 μM), their combination, or their liposomes for 4 h. In (c–e,g,j), the experiments were repeated independently three times to confirm the results. Data represent mean ± SD. Two-tailed Student’s t test. NS no significance; ** P < 0.01. Source data are provided as a Source Data file.

