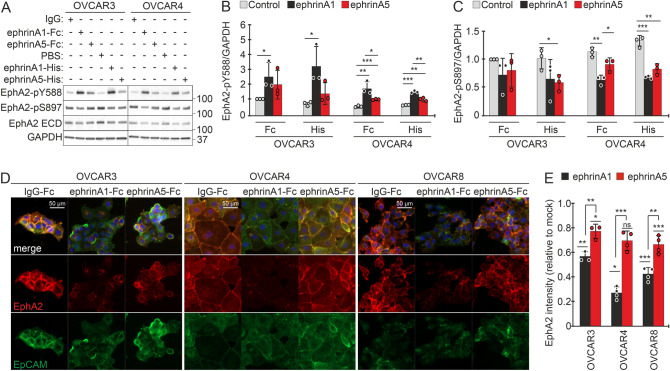
Figure 3.
EphA2 activation by ephrinA5 results in weaker canonical EphA2-pY588 signaling than upon ephrinA1-mediated activation. (A–C) EphA2 (total and phosphorylated at Y588 or S897) in OVCAR3 and OVCAR4 after treatment with soluble recombinant dimeric (Fc-tagged) and monomeric (His-tagged) ephrinA1 and ephrinA5 for 120 min were assessed by immunoblotting (A) and quantified for EphA2-pY588 (B) and EphA2-pS897 (C). N = 3. Full-length blots are presented in Supplementary Fig. 5. (D, E) Fluorescent micrographs of EphA2 (red) and EpCAM (green) in ephrinA1-Fc and ephrinA5-Fc treated OVCAR3, OVCAR4, and OVCAR8 cells (D) and corresponding EphA2 quantification (E). N = 3 (OVCAR3) or 4 (OVCAR4 and OVCAR8). Mock is set to one. p values (Student’s t-test): ns = not significant, *< 0.05; **< 0.01; ***< 0.001.

