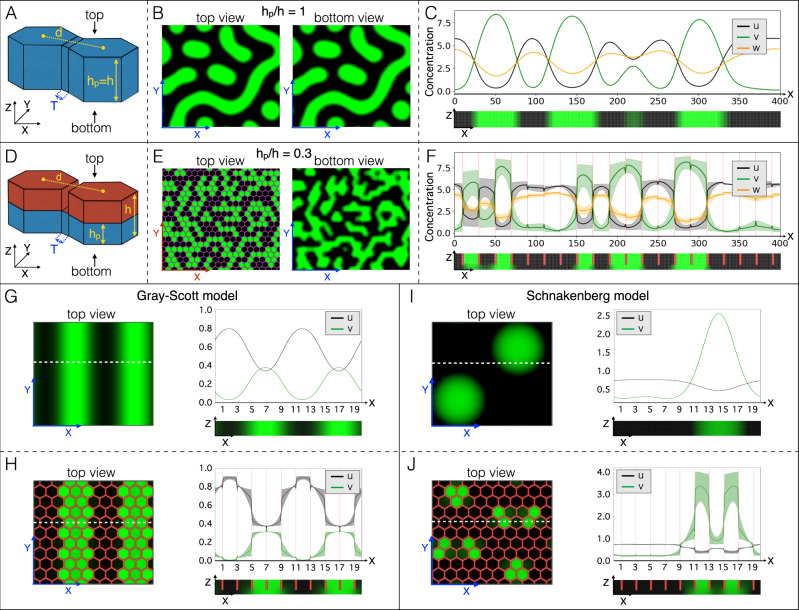
Fig. 2. Geometry transforms continuous RD into discretised systems.
A–C When the domain does not exhibit variation of thickness (A), the steady-state RD pattern does not vary between top and bottom views of the simulated skin (B), and the concentrations of RD components show continuous spatial variation (C; concentration profile at y=0 averaged across z) and no variation in the z direction (bottom panel in C). D–F When the domain thickness is substantially smaller (hp) in between (T) than within (h) prisms (D; hp/h = 0.3), a prism-by-prism coloration emerges (E) with sharp transitions of concentrations of RD components at prisms’ borders (F; average concentrations at y = 0; shaded regions are minimum-maximum concentration intervals in the z direction). Broader gradients at borders of prisms in bottom view (see also bottom panel of F) are due to unconstrained diffusion in the basal part of the simulation domain. G–J Variation of domain thickness (hp/h = 0.3 in H and J) also transforms simpler two-component continuous RD models into discrete systems (H, J). Profiles of average concentrations (at the y coordinate indicated by the white dotted lines) are shown; shades in (H, J) are minimum-maximum concentration intervals in the z direction.

