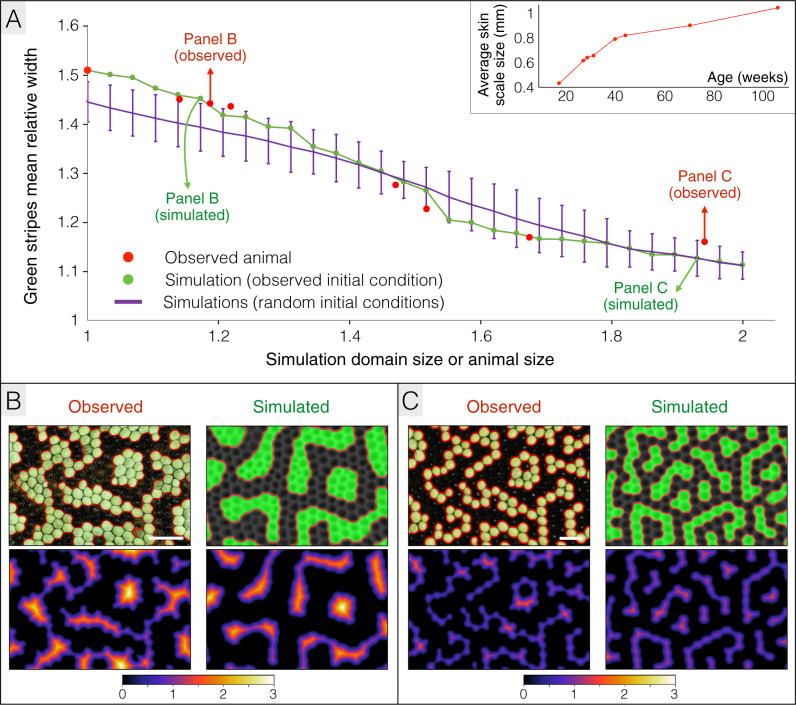
Fig. 5. Growth affects patterning dynamics.
A Growth (inset: growth curve of the animal) causes a monotonous decrease in the mean relative length scale of the pattern both in the real animal (red spots = 18, 28, 30, 32, 41, 45, 71 and 106 week-old animal) and in a quasi-static growth simulation (green line; initial condition = 18-week-old observed pattern). The purple line shows the time evolution of the pattern mean length scale averaged among 20 independent simulations starting form different random initial conditions (30% randomly-distributed black skin scales); error bars = 3 standard deviation intervals. Simulations were performed in 2D by applying dimensionality reduction on the 3D chromatophore domain (Fig. 3D). The size of simulation domains is normalised to the skin patch size at 18 weeks. B, C Comparisons between real and simulated patterns for normalised domain sizes of ≈1.15 (B) and ≈1.95 (C). Top panels show the patterns with detected borders (indicated in red) and bottom panels show the distance (expressed in average skin scales) of each green scale to the border. The observed and simulated patterns both exhibit green labyrinthine stripes that are 2–3 and 1–2 skin scales wide in B and C, respectively. Scale bars = 2 mm. Time evolution of the pattern length scale is also illustrated in Supplementary Movie 1.

