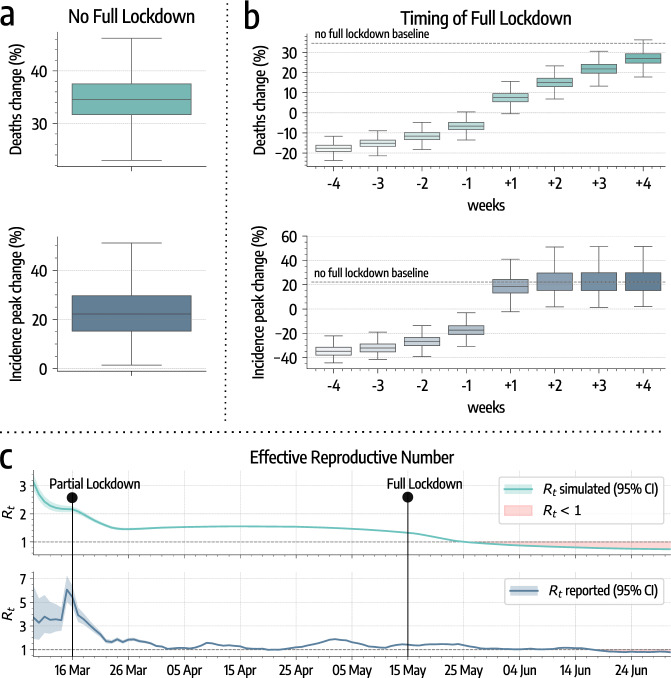
Fig. 3. Impact of nonpharmaceutical interventions on COVID-19 spreading.
a Model estimates of percentage increases in deaths and incidence peak intensity without the implementation of the full lockdown (based on n = 5000 stochastic realizations). b Model estimates of percentage changes in deaths and in incidence peak intensity moving the date of the full lockdown of −4/+4 weeks (based on n = 5000 stochastic realizations). In both panels, the center of the boxes indicates the median, the bounds indicate the interquartile range (IQR) (i.e., the range between first quartile, Q1, and third quartile, Q3), and the whiskers indicate the minimum and the maximum defined respectively as Q1 − 1.5IQR and Q3 + 1.5IQR. c Effective Reproductive Number Rt estimated on simulated and officially reported cases. The two time series show a high positive Pearson correlation coefficient (ρ = 0.78, p < 0.001). The shaded red area indicates Rt < 1.

