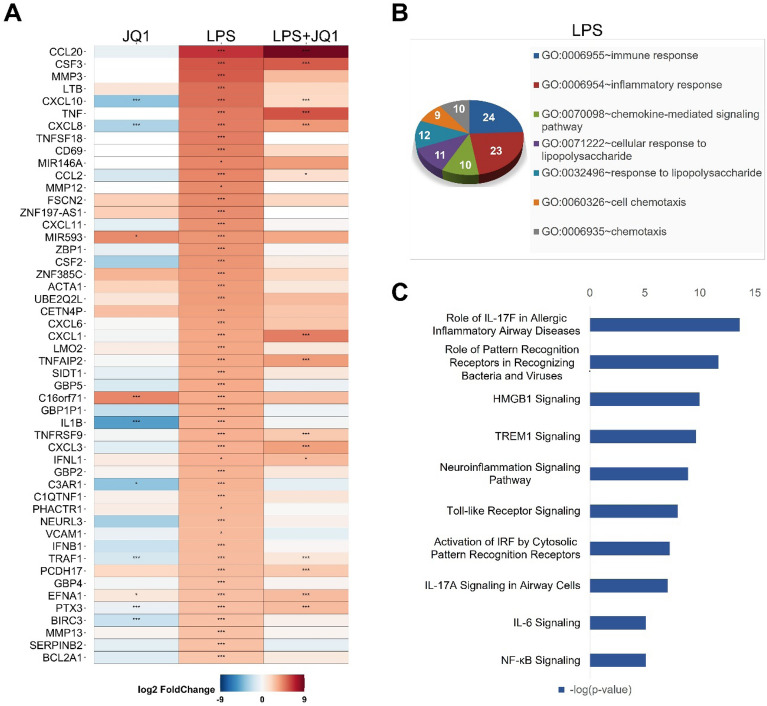
Figure 2.
Differentially expressed genes in LPS- and LPS + JQ1-treated HMC3 cells. (A) Heat map showing the top 50 upregulated genes in HMC3 cells treated with LPS and LPS + JQ1 for 4 h determined by RNA-seq (p ≤ 0.05 and fold change ≥ 1.5 log2). Each experiment was performed in experimental triplicates (n = 3) for each condition, and the results were individually combined. The color scale shown in the heat map represents the log2 fold change values. Red cells indicate upregulated gene, while blue cells indicate downregulated genes. The p-value with an asterisk attached in the cell represents *p < 0.05, **p < 0.01, and ***p < 0.001. (B) GO term analysis of the biological processes associated with up- and downregulated genes after LPS (100 ng/ml) and JQ1 (500 nM) treatment for 4 h. GO analysis of the number of genes shown in the van diagram. (C) Biological pathway analysis of DEGs in cells treated with LPS and LPS + JQ1 using IPA (QIAGEN Inc., https://www.qiagenbioinformatics.com/products/ingenuitypathway-analysis) showed up- and downregulated genes.

