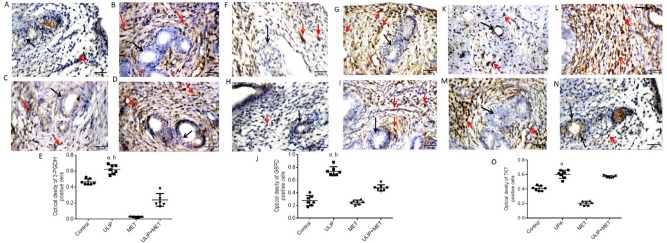
Figure 6.
Effect of ulipristal and/or metformin on the expression of proteins involved in glucose metabolism in rats’ uteri. (A–D) photomicrographs of uteri shows expression of 3-PHGDH. (A) Uterine wall in the control group. (B) Uterine wall in ulipristal treated group. (C) Uterine wall in metformin treated group. (D) Uterine wall in the ulipristal and metformin treated group. × 400 magnification (scale bar = 20 μm). (E) Expression quantification of the optical density reactivity of positive cells of 3-PHGDH by the ImageJ analysis system. (F–I). Photomicrographs of uteri shows expression of G6PD. (F) Uterine wall in the control group. (G) Uterine wall in ulipristal treated group. (H) Uterine wall in metformin treated group. (I) Uterine wall in the ulipristal and metformin treated group. × 400 magnification (scale bar = 20 μm). (J) Expression quantification of the optical density reactivity of positive cells of G6PD by the ImageJ analysis system. (K–N) Photomicrographs of uteri shows expression of TKT. (K) Uterine wall in the control group. (L) Uterine wall in ulipristal treated group. (M) Uterine wall in metformin treated group. (N) Uterine wall in ulipristal and metformin treated group. × 400 magnification (scale bar = 20 μm). (O) Expression quantification of the optical density reactivity of positive cells of TKT by the ImageJ analysis system. Data in figures (E & J & O) is represented by mean ± SD (n = 7). a or b, Statistically significant from the control or ulipristal & metformin treated group respectively at P < 0.05 using one-way ANOVA followed by Tukey as a post hoc test. UPA ulipristal, MET metformin, UPA + MET co-treatment with ulipristal and metformin.

