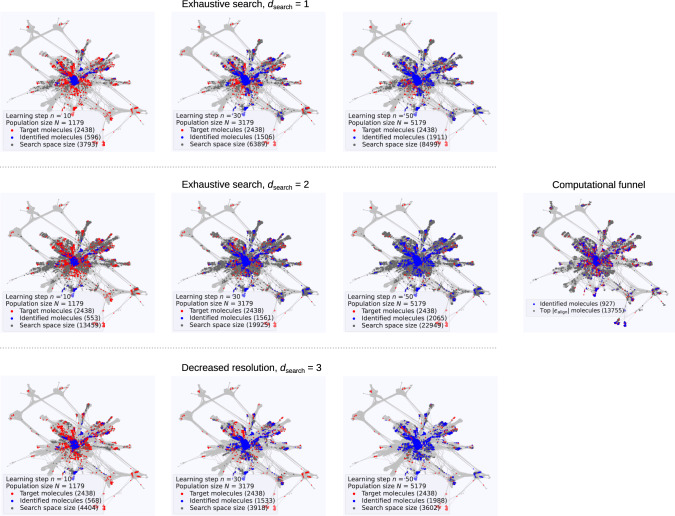
Fig. 3. AML exploration of the finite test space.
The same CSN representation of the OSC test space as in Fig. 2 is shown in gray. Superimposed are the target group of 2438 top-performing molecules in red. Each panel shows the discovery success after n learning steps with the color of all identified top-performing molecules changed to blue and the search space for the next learning step n + 1 colored in dark gray. Left upper panels: Steps n = 10, 30, 50 for an exhaustive search with search depth of one. Left middle panels: Steps n = 10, 30, 50 for an exhaustive search with search depth of two. Left lower panels: Steps n = 10, 30, 50 for a decreased resolution search (Ndeep = 500) with search depth of three (see text). Supplementary Movies 1–3 provide the detailed, full trajectory of all three AML discovery runs over learning steps 1–50. Right centered panel: Discovery success of a conventional computational funnel after computing an equal number of descriptors (5179) as after 50 learning steps, and anticipating that knowledge of 13.755 molecules with optimum ∣ϵalign∣ < 0.3 eV is present (see text).

