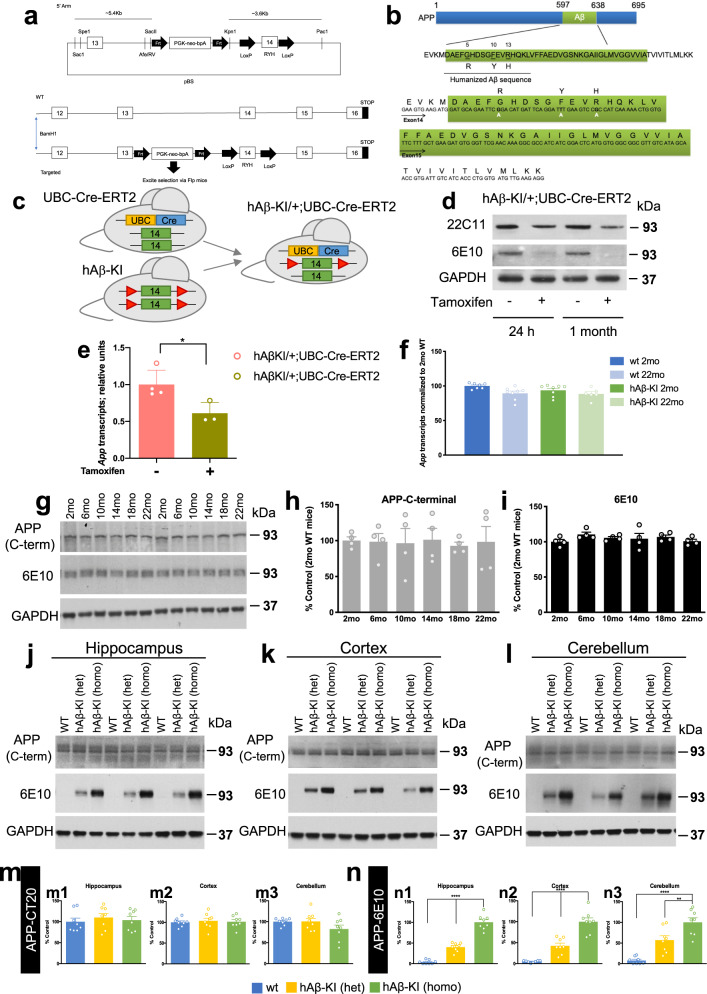
Fig. 1. Humanized Aβ sequence design and APP levels in the hAβ-KI mice.
a Strategy for production of hAβ-KI mice. b Schematic representation of humanized Aβ in hAβ-KI mice. c Breeding strategy to produce ApphAβ-KI/+; UBC-Cre-ERT2 hemizygous mice (green box = exon 14, red triangle = loxP sequence, yellow and blue box = UBC-Cre-ERT2). d Western-blot analysis showing that Tamoxifen treatment reduces APP expression (22C11 antibody) in brains of ApphAβ-KI/+; UBC-Cre-ERT2 hemizygous mice compared to PBS-treated animals. The hAβ specific product (6E10 antibody) expressed by the floxed hAβ-KI allele is depleted following Tamoxifen treatment. e qPCR analysis of App expression shows decrease in Tamoxifen-treated ApphAβ-KI/+; UBC-Cre-ERT2 hemizygous mice (green) versus PBS-treated mice (pink) (PBS n = 4 and tamoxifen n = 3; unpaired, two-tailed t-test, *p = 0.035). f No difference in App expression in CNS of WT and hAβ-KI homozygous mice at 2 and 22 month of age (transcript level normalized to 2 mo-WT animals; n = 6 in hAβ-KI 22 mo, n = 7 in WT 2 mo and n = 8 in WT 22 mo and hAβ-KI 2 mo) (blue = WT 2 mo, light-blue = WT 22 mo, green = hAβ-KI 2 mo and light-green = hAβ-KI 22 mo). g–i Immunoblot analysis of APP recognized by C-terminal APP (CT-20 antibody) (dark-gray) and 6E10 (hAβ-specific) (black) antibody in hippocampal homogenates of hAβ-KI from 2 to 22 months of age (n = 4/genotype/age) shows no differences in APP expression. Representative immunoblot analysis of APP holoprotein using APP-CT20 (detect both mouse and human APP) and 6E10 (recognize only human Aβ) in hippocampal (j), cortical (k) and cerebellar (l) homogenates of WT (blue), hAβ-KI (het) (yellow) and hAβ-KI (homo) (green) (n = 8/genotype). m Quantification of j, k and l shows no difference in APP steady-state level between groups and brain areas. n Quantification of j, k and l by 6E10 antibody shows dose-dependent expression of APP in hAβ-KI homozygous mice in the hippocampus (One-way ANOVA, F2,21 = 124.0, Tukey’s post hoc test, ****p < 0.0001), cortex (One-way ANOVA, F2,21 = 53.43, Tukey’s post hoc test, ****p < 0.0001) and cerebellum (One-way ANOVA, F2,21 = 26.83, Tukey’s post hoc test, **p < 0.01 and ****p < 0.0001) compared to WT mice and hAβ-KI heterozygous mice. Data are presented as mean values ± SEM.

