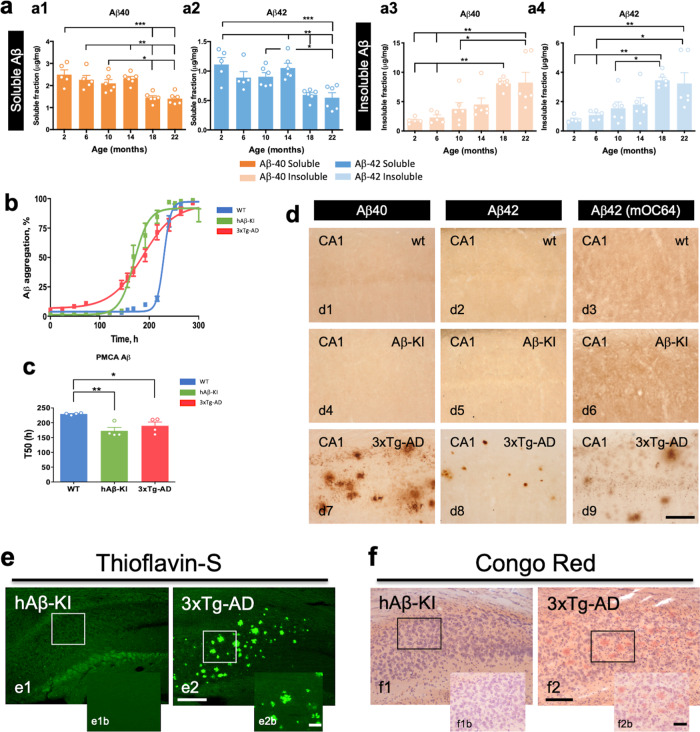
Fig. 2. Changes in Aβ as a function of age in hAβ-KI mice.
a Aβ40 (orange) and Aβ42 (blue) quantity in hAβ-KI homozygous mice was determined using the MSD V-PLEX Plus Aβ Peptide Panel 1 (6E10) Kit (n = 5 in 2 mo and 6 mo and n = 6 in 10 mo, 14 mo, 18 mo and 22 mo). The ELISA analysis shows that hAβ-KI mice produce high soluble Aβ levels, including Aβ40 (One-way ANOVA, F5,28 = 10.01, Tukey’s post hoc test, *p < 0.05, **p < 0.01 and ***p < 0.001) and Aβ42 (One-way ANOVA, F5,28 = 8.057, Tukey’s post hoc test, *p < 0.05, **p < 0.01 and ***p < 0.001) compared to old hAβ-KI mice (a1 and a2). Opposite effect is observed in insoluble Aβ levels in older hAβ-KI mice compared to younger hAβ-KI mice, including in Aβ40 (One-way ANOVA, F5,28 = 7.21, Tukey’s post hoc test, *p < 0.05 and **p < 0.01) and Aβ42 (One-way ANOVA, F5,28 = 6.543, Tukey’s post hoc test, *p < 0.05 and **p < 0.01) (a3-a4). b Aβ-PMCA shows accelerated in vitro aggregation using hAβ-KI (green) and 3xTg-AD (red) brain homogenate to seed monomeric Aβ compared to WT (blue) controls (n = 4/genotype). c Shorter time to reach 50% of total aggregation, measured by thioflavin-T emission levels (n = 4/genotype) (One-way ANOVA, F2,11 = 9.083; Tukey’s post hoc test, *p < 0.05 and **p < 0.01). d Immunohistochemistry performed with Aβ40 and Aβ42 antibodies showed no sign of aggregates (plaques) for Aβ isoforms in hAβ-KI mice at 22-month of age (d4–d6). As a positive control, 3xTg-AD mice were used with significant Aβ40 and Aβ42 aggregates present at 22-month of age (d7–d9). WT mice showed no staining for both Aβ isoforms (d1–d3). 22-month-old hAβ-KI mice and 3xTg-AD mice were stained with thioflavin-S (Thio-S) (e) or Congo Red (f) stain. No fibrillar aggregated stained with Thio-S or Congo red is observed in hAβ-KI (e1 and f1). As a positive control, 3xTg-AD mice were used with fibrillary extracellular aggregates positive for Thio-S and Congo Red present in the hippocampus (e2 and f2). Data are presented as mean values ± SEM. Scale bar: 200 μm (e1, e2, f1 and f2), 100 μm (d1–d9) and 50 μm (e1b, e2b, f1b and f2b).

