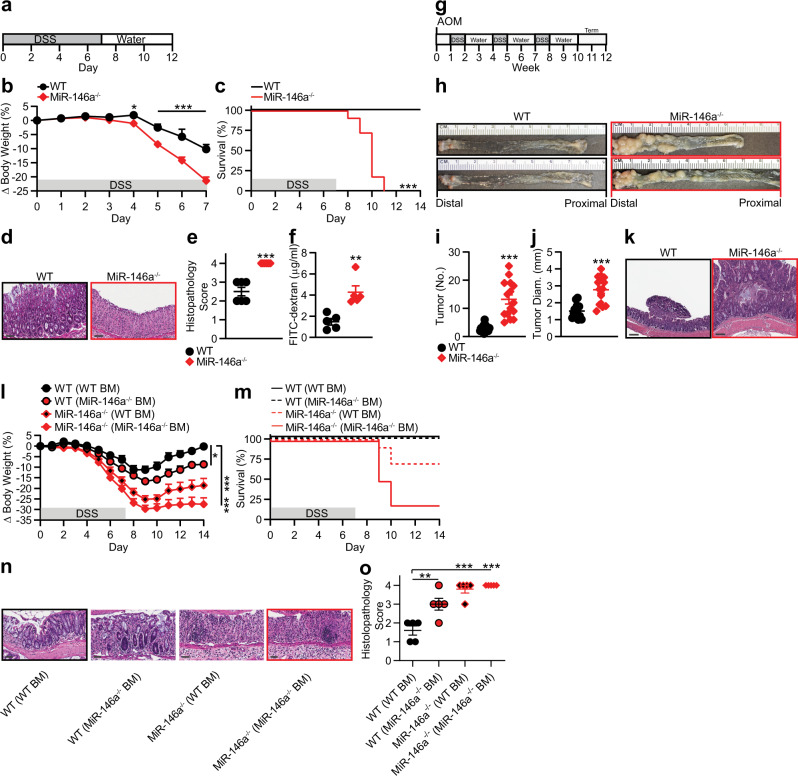
Fig. 1. MiR-146a deficiency promotes colonic inflammation and colitis-associated colon cancer.
a Schematic of DSS colitis induction: 3% DSS was given in water for 7 days, followed by untreated drinking water for 7 days. b, c Percent body weight changes (n = 15) (b) and survival (n = 11) (c) in colitic WT and miR-146a−/− mice. d, e Representative colonic histopathology with H&E staining (scale bar = 50 µm) (d) and histopathological scores (e) based on degree of ulceration from colitic mice on day 7 (n = 6). f FITC-dextran uptake in colitic mice on day 7. Mice were deprived of food and water for 6 h, then given FITC-dextran (400 mg/kg b.w.) by oral gavage. Four hours later, mice were bled and serum was collected. Fluorescence intensity was measured by spectrophotometer (n = 5). g Schematic of AOM/DSS inflammation-associated CRC induction: AOM was given i.p. (10 mg/kg b.w.), followed by 3 cycles of 2% DSS. h–j Representative images (h), numbers (i), and sizes (j) of colonic tumors in WT and miR-146a−/− mice with AOM/DSS-induced CRC (n = 14–15). k Representative colonic histopathology (scale bar = 200 µm) with H&E staining in WT and miR-146a−/− mice with AOM/DSS-induced CRC. l, m Percent body weight changes (l) and survival (m) in BM chimeric mice with DSS-induced colitis. WT and miR-146a−/− mice were irradiated and reconstituted with WT or miR-146a−/− BM, for 6 weeks (n = 9–10). Weight changes were compared to WT (WT BM) on day 14. n, o Representative colonic histopathology (scale bar = 50 µm) stained with H&E (n) and histopathological scores (o) of colitic chimera mice on day 7 (n = 5). Comparisons are to WT (WT BM). Data are representative of ≥2 independent experiments. n = biologically independent replicates per group. Mean ± SEM. *p < 0.05, **p < 0.01, ***p < 0.001, by two-way ANOVA with Bonferroni adjustment (b), two-way Kaplan–Meier survival analysis (c), one-way ANOVA with Dunnett adjustment (I, o), or two-tailed Student’s t-test (e, f, i, j). Source data are provided as a Source data file.

