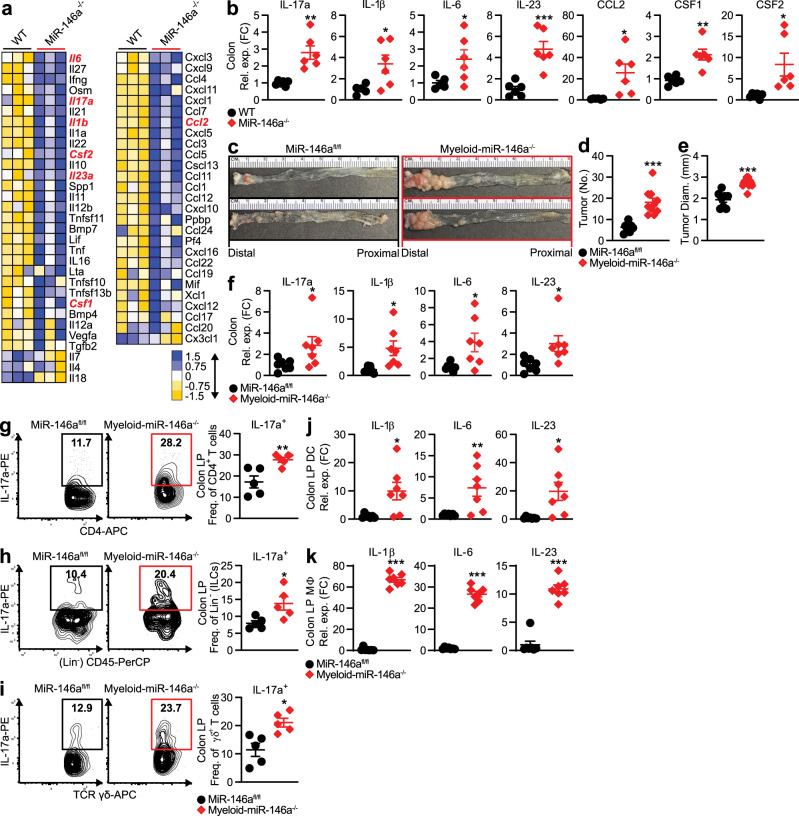
Fig. 2. Myeloid cell-specific deletion of miR-146a promotes CRC development.
a Inflammatory Cytokines and Receptors RT2 Profiler PCR Array (Qiagen) in distal colon from colitic WT and miR-146a−/− mice (n = 3). b qPCR of IL-17 and IL-17-promoting cytokines in CRC tissue from WT and miR-146a−/− mice with AOM/DSS-induced CRC (n = 6–7). c–e Representative images (c), numbers (d), and sizes (e) of colonic tumors in miR-146afl/fl and myeloid-miR-146a−/− (LysMCremiR-146afl/fl) mice with AOM/DSS-induced CRC (n = 8–10). f qPCR of IL-17 and IL-17-inducing cytokines in CRC tissue from miR-146afl/fl and myeloid-miR-146a−/− mice (n = 7). g–i Representative FACS plots and frequencies of IL-17a in CD4+ T cells (Th17) (g), (Lin−CD45+) ILCs (h), and (CD3+ δ+) γδ+ T cells (i) from the colonic LP of miR-146afl/fl and myeloid-miR-146a−/− mice with AOM/DSS-induced CRC (n = 5). j, k qPCR of IL-17-inducing cytokines in CD11c+ DCs (j) and CD11b+ MΦs (k) from the colonic LP of CRC miR-146afl/fl and myeloid-miR-146a−/− mice (n = 7). qPCR data as FC from WT or miR-146afl/fl (b, f, j, k). Data are representative of ≥2 independent experiments. n = biologically independent replicates per group. Mean ± SEM. *p < 0.05, **p < 0.01, ***p < 0.001, by two-tailed Student’s t-test (b, d–k). Source data are provided as a Source data file.

