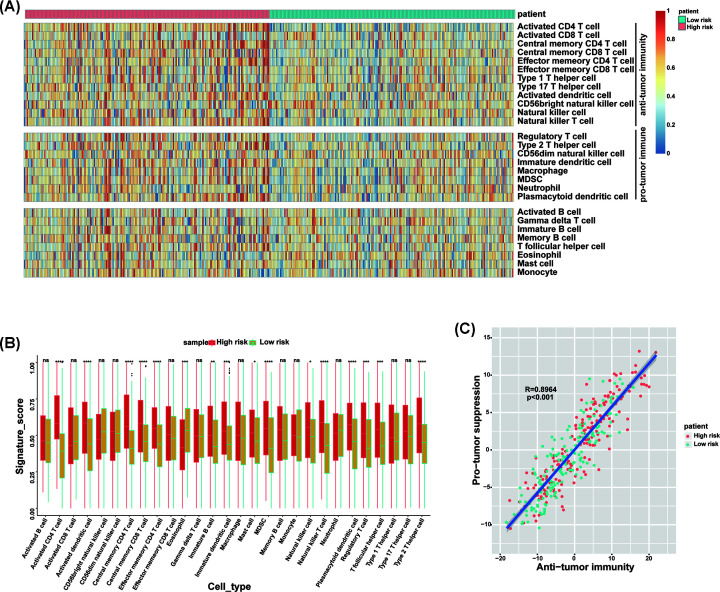
Figure 7. ssGSEA of high- and low-risk groups.
(A) Heatmap of normalized (Z-score) score of 28 infiltrating immune cell populations. (B) The signature score of 28 infiltrating immune cells in high- and low-risk groups. (C) Correlation between infiltration of cell types executing anti-tumor immunity and cell types executing pro-tumor immune suppressive functions. R coefficient of Pearson’s correlation. The shaded area represents 95% confidence interval. Red points represent high-risk patients, green points represent low-risk patients.*P<0.05, **P<0.01, ***P<0.001, ****P<0.0001.

