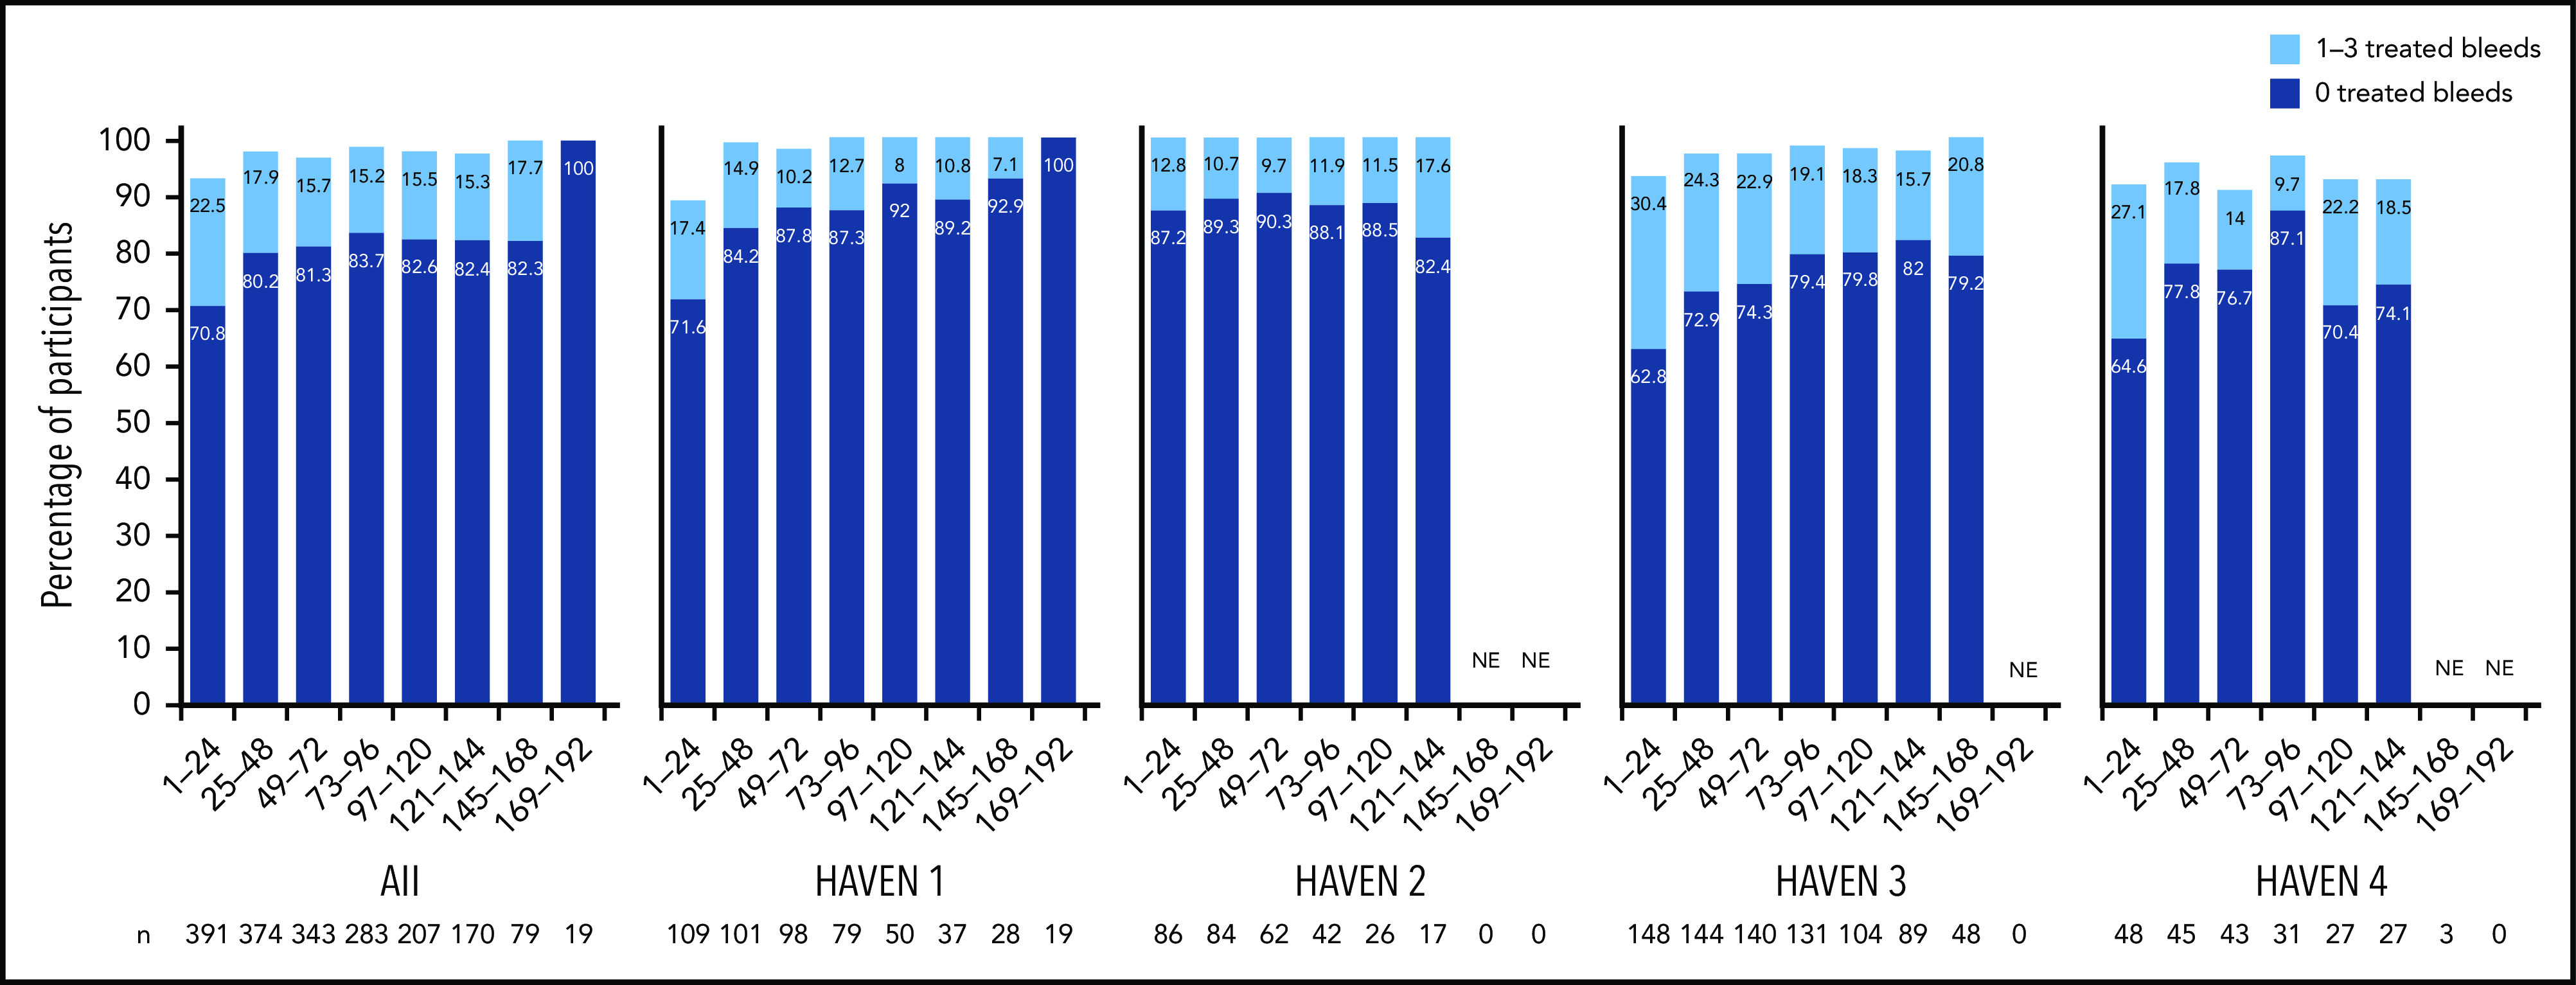
Figure 4.

Proportion of participants with 0 or 1 to 3 treated bleeds by HAVEN study across 24-week treatment intervals. A treated bleed was defined as a bleed followed by treatment of a bleed; bleeds due to surgery/procedures were excluded. Only data for time intervals with ≥10 participants are reported; for inclusion within a time window, participants needed to have completed the entire 24-week interval (without uptitration). NE, not estimated.
