Figure 5.
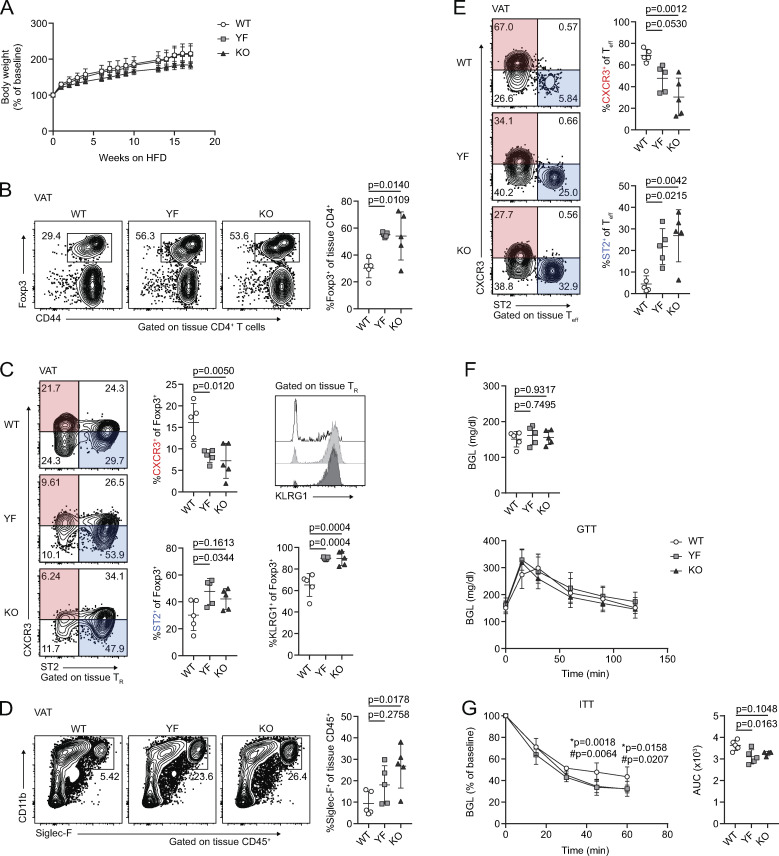
Mice deficient in ICOS signaling maintain anti-inflammatory immune cell abundance and phenotype in VAT after a long-term HFD, correlating with improved insulin sensitivity. (A) Percentage of baseline body weight at indicated time points following initiation of an HFD. (B) Tissue-localized VAT-TR frequency after 18 wk of an HFD. (C) VAT-TR phenotypic data as measured by flow cytometry showing expression of CXCR3, ST2, and KLRG1. (D) Frequency of tissue-localized eosinophils in VAT. (E) Representative gating of VAT-Teffs on CXCR3 and ST2 with summarized graphical data. (F) Fasting BGL (top) and GTT (bottom) in HFD-fed mice. (G) ITT in HFD-fed mice. * indicates significant difference between WT and YF; # indicates significant difference between WT and KO. ITT area under the curve (AUC) was calculated for each individual mouse. All data are representative of two independent experiments with n = 4 or 5 per group. For weight (A), GTT (F), and ITT (G), statistical significance was determined using two-way repeated-measures ANOVA with Tukey’s post-test for multiple comparisons. For fasted BGL (F), ITT AUC (G), and all flow cytometry summary graphs, statistical significance was determined using one-way ANOVA with Tukey’s post-test. All graphs are presented as mean values ± SD.

