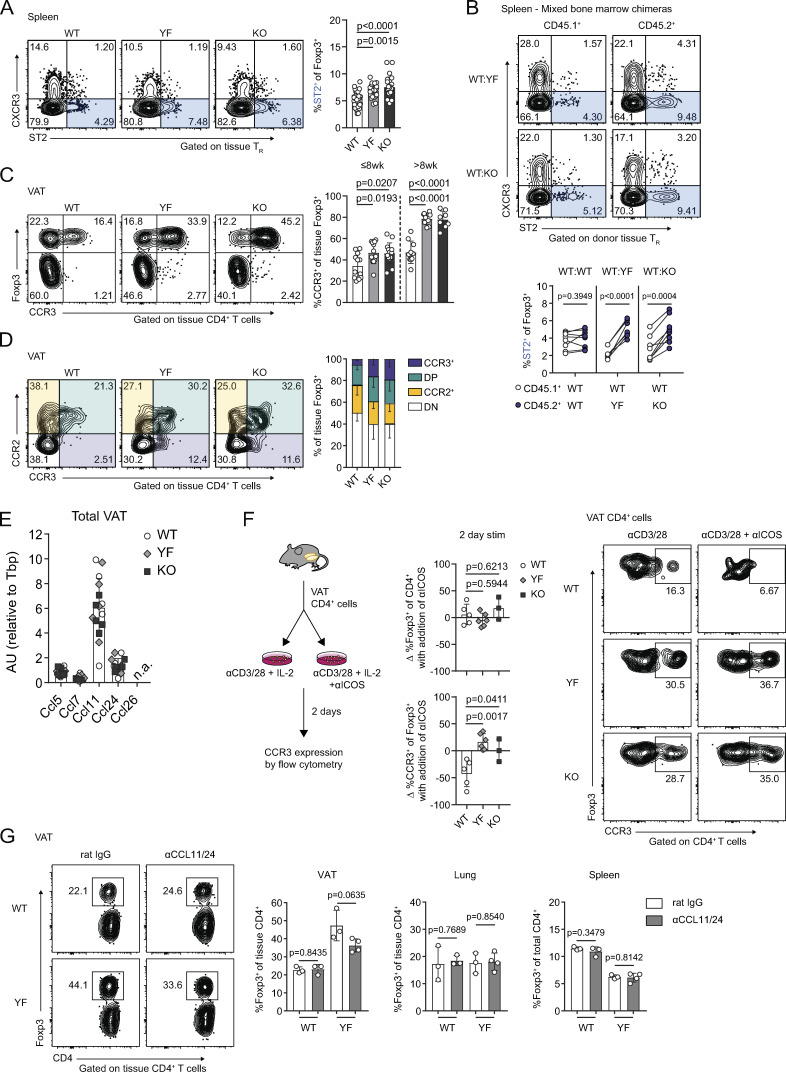
Figure 8.
Increased VAT-TR accumulation in the absence of ICOS signaling is associated with elevated CCR3 expression. (A) ST2 expression in splenic TRs (n = 3–5 per group from eight independent experiments). (B) ST2 expression in CD45.1+ and CD45.2+ donor splenic TRs in WT:YF and WT:KO chimeric mice. Lines connect CD45.1+ and CD45.2+ donor splenic TRs within the same chimera (n = 3–5 chimeric mice per group from three independent experiments). (C) Expression of CCR3 in VAT-TRs in mice ≤8 wk and >8 wk of age (n = 3–5 per group from seven independent experiments). (D) Expression of CCR2 and CCR3 by VAT-TRs (n = 3–5 per group from two independent experiments). DP, CCR2+CCR3+; DN, CCR2−CCR3−. (E) Expression of indicated CCR3 ligands in total VAT normalized to Tbp as measured by qPCR (n.d. indicates not detected; n = 5 per group). (F) Schematic of in vitro culture experiments examining the impact of ICOS signaling on CCR3 expression (left). Graphs indicating fold change in TR frequency of CD4+ cells and %CCR3+ of TRs between individual culture samples stimulated (stim) with or without αICOS for 2 d (middle). Representative flow cytometry plots with frequency of CCR3+ TRs after 2 d in specified culture conditions (right; n = 1–3 per group from three independent experiments). (G) Left: Representative flow cytometry plots indicating VAT-TR frequency with or without CCL11/24 blockade. Graphs summarize TR frequencies in indicated tissues after 2 wk (n = 3–4 per group). Mice were age matched within independent experiments and collectively; pooled data are from experiments using male mice aged 8–16 wk unless otherwise indicated. Statistical significance was determined using one-way ANOVA with Tukey’s post-test (A and C); two-tailed, paired Student’s t test for expression in donor cells within the same chimeric mouse (B); and two-tailed Student’s t test (F and G). All data are presented as mean values ± SD.

