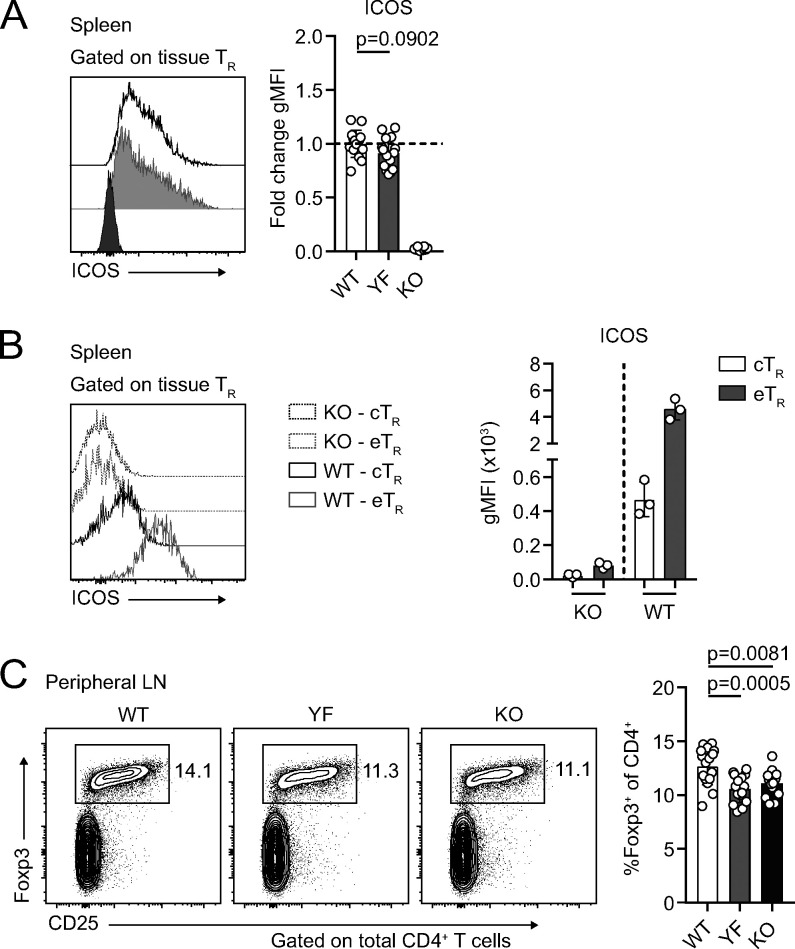
Figure S1.
Despite normal surface expression of ICOS, YF mice phenocopy KO with equivalent loss of lymphoid TRs (goes with Fig. 1). (A) ICOS expression on gated WT, YF, and KO splenic TRs. Fold change of ICOS gMFI is compared with average expression in WT TR for each individual experiment. Dashed line marks average value of WT control samples (n = 3 per group from five independent experiments). (B) Representative ICOS expression on gated splenic KO and WT CD44loCD62Lhi cTR and CD44hiCD62Llo eTRs as measured by flow cytometry (n = 3 per group from five independent experiments). (C) TR frequencies of total CD4+ T cells in pLNs (n = 2–5 per group from five independent experiments). Mice were age matched within individual experiments, and quantified data are pooled from experiments using male mice 8–16 wk of age. Statistical significance was determined using one-way ANOVA with Tukey’s post-test. All data are presented as mean values ± SD.

