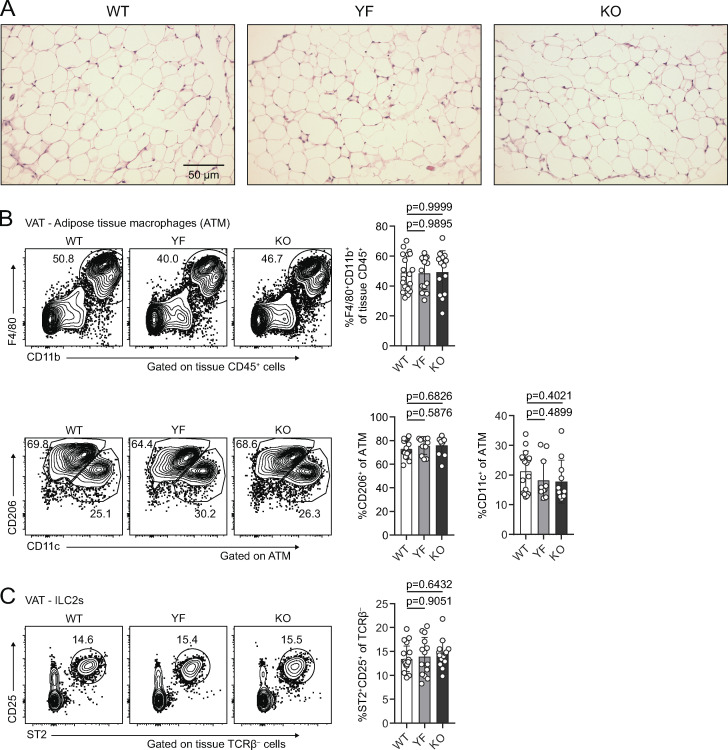
Figure S3.
Adipocyte, ATM, and ILC2 populations are unchanged in YF and KO VAT (goes with Fig. 4). (A) H&E staining of VAT from 8-wk-old male mice. (B) Representative flow cytometry plots and quantification of tissue-localized ATM in WT, YF, and KO mice (top). Representative gating of ATM on CD11c and CD206 to identify M1-like and M2-like macrophages, respectively (bottom; n = 2–6 per group from six independent experiments). (C) Frequency of tissue-localized ILC2s in VAT as measured by flow cytometry (n = 2–6 per group from six independent experiments). Mice were age matched within individual experiments, and pooled data are from experiments using 8–16-wk-old male mice. Statistical significance was determined using one-way ANOVA with Tukey’s post-test. All data are presented as mean values ± SD.

