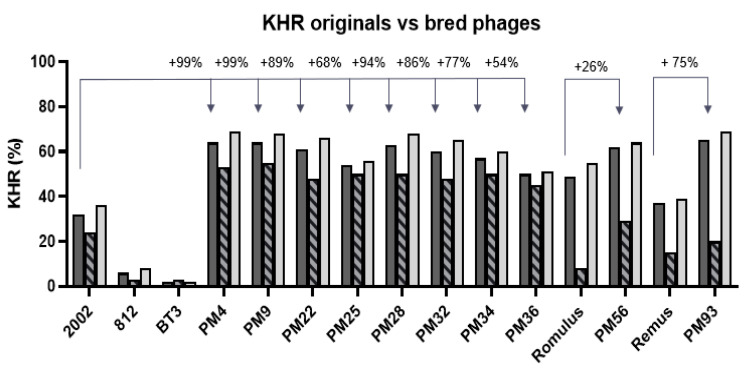
Figure 2.
Improvement of kinetic host range of ε2 phages. Kinetic host ranges of the bred bacteriophages and their ancestors calculated for the overall panel of 110 S. aureus strains (dark grey bars). The data representing the overall KHR of the ancestor phages is identical to the KHR data in Figure 1A. For the breeding strains (dashed bars) and the strains not used for breeding (light grey bars). The KHR was improved on strains used for breeding and on strains not used for breeding. Improvement is indicated as a percentage calculated over the wild type ancestor with the highest KHR value, as indicated with the arrows, from unrounded KHR values.

