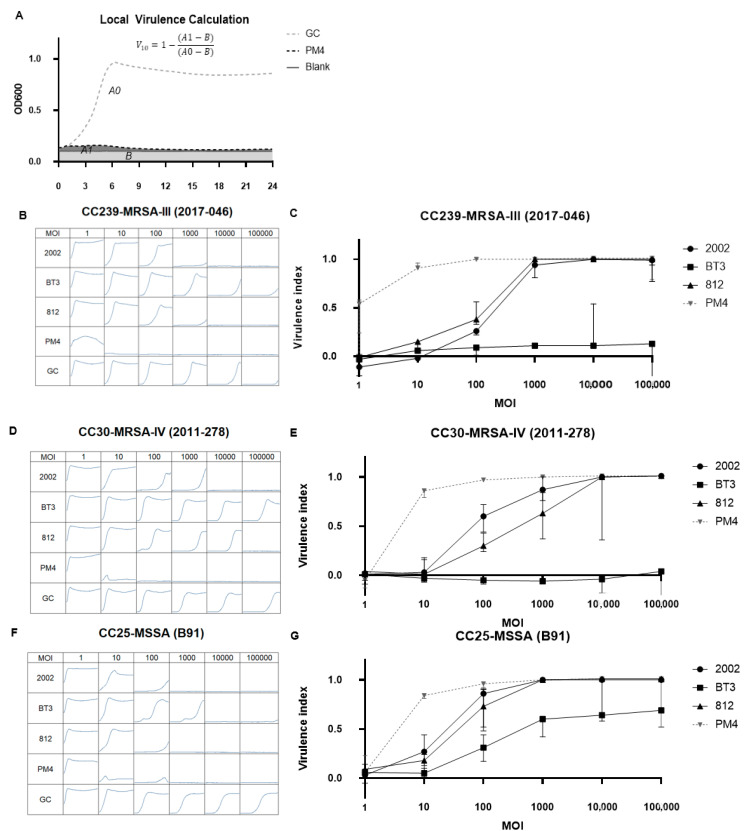
Figure 3.
Comparison of the virulence of PM4 and its ancestors 2002, BT3 and 812. (A) Illustration of the calculation of local virulence V10. Phage virulence at a defined MOI is termed local virulence V10 (the subscript indicates the MOI), calculated with the formula on top of the graph. A1 and A0 are the areas under the OD600 curves of the treated and untreated samples, respectively. B is the blank area. (B,D,F) depict the lytic activity of the bred bacteriophage PM4 and its ancestors at different starting MOIs and on three different strains: CC239-MRSA-III (2017-046), CC30-MRSA-IV (2011-278), CC25-MSSA (B91), respectively. Graphs show optical density measurements at 600 nm (OD600) of bacterial suspensions in presence or absence (GC: growth control) of the bacteriophages in a 96-well plate for 24 h at 37 °C. The bacterial strain name is depicted as title, the bacteriophages on the left and the different MOIs at the top of each column. The concentration of the phages was kept constant at 5 × 10⁸ PFU/mL and starting CFU/mL were modified to reach the different MOI concentrations. (C,E,G), depict virulence curves of the three ancestor phages and PM4. The virulence curves were calculated by plotting the local virulence as a function the starting MOI used in the experiment.

