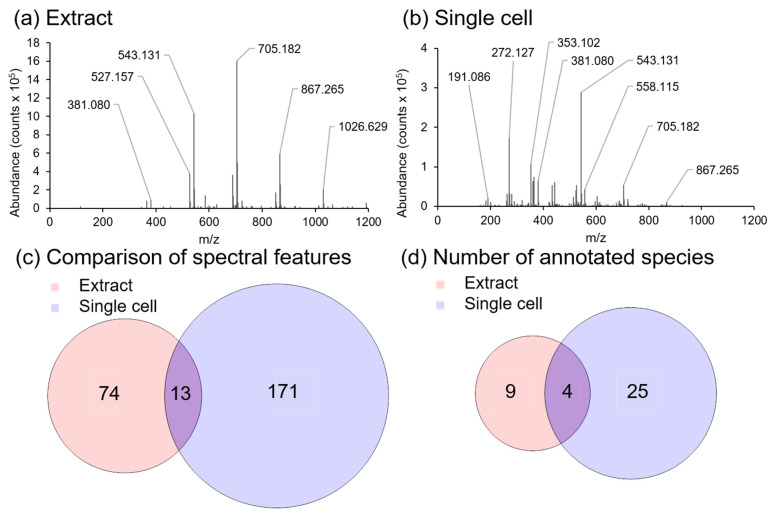
Figure 5.
Spectral comparison of an aqueous extract from homogenized A. Cepa, and a single A. Cepa epidermal cell with LAESI-MS. (a) Positive ion spectrum acquired by ablation of a 3 µl droplet of an A. Cepa tissue extract on a parafilm coated microscope slide with LAESI-MS, and (b) positive ion spectrum of an A. Cepa single epidermal cell. (c) Venn diagram showing the number of unique and shared spectral features between the aqueous extract and the single cell spectra. (d) Venn diagram showing the number of unique and shared annotated species between the aqueous extract and the single cell spectra.

