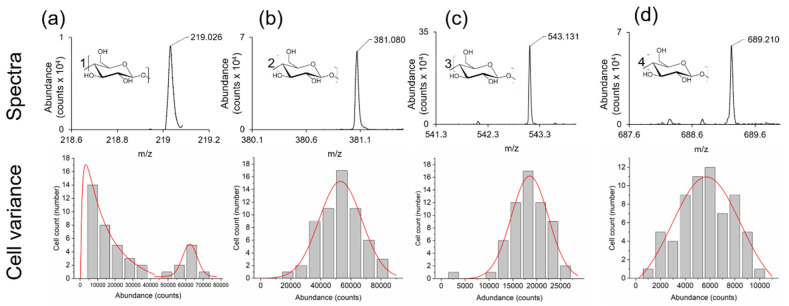
Figure 6.
Exploring the variance in the abundance of saccharides within single cells of A. Cepa. i = 60 single cells. Monosaccharide (a), disaccharide (b), trisaccharide (c), tetrasaccharide (d). Spectra and structures for each of the saccharides (top row), and abundance (counts) for the saccharides within the 60 cells set (bottom row). Distribution fits are also shown (red lines).

