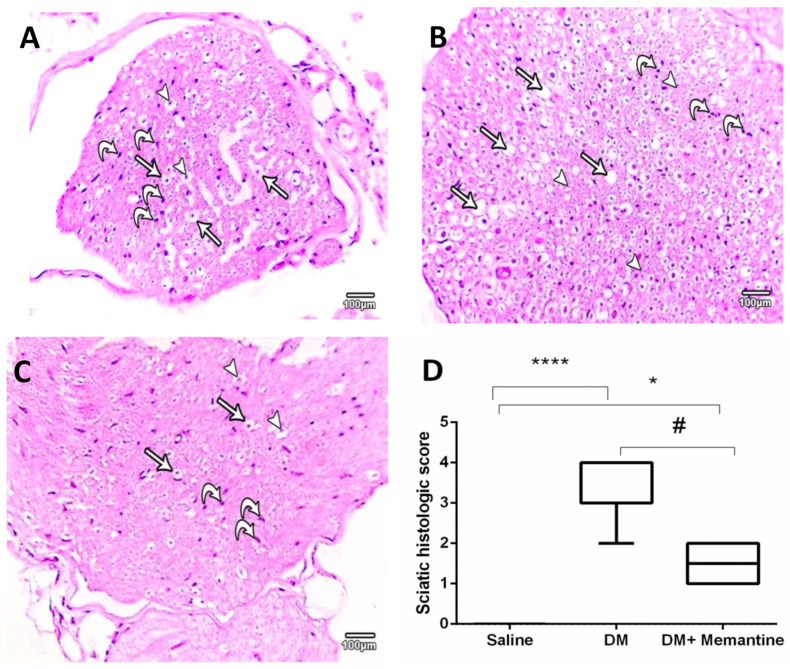
Figure 5.
Microscopic pictures of hematoxylin and eosin stained sections of sciatic nerves. (A) An image from the saline group presenting multiple axons (arrowheads) found in different thicknesses of myelin sheathes (arrows) and enclosed within the endoneurium with multiple nuclei of Schwann cells (curved arrows). (B) Diabetic group (DM) showing several lost axons (arrows) with lost myelin sheathes (arrowheads) with some Schwann cell nuclei (curved arrows). (C DM+memantine shows normal neuronal axons (arrowheads) with normal myelin sheath (arrows) and an increased number of Schwann cells nuclei (curved arrows). ×100 bar 100 μm. (D)) Data from histopathologic scoring of the sciatic nerve sections as a box-whisker plot demonstrating the median values and analyzed by Kruskal–Wallis ANOVA. * p < 0.05, and **** p < 0.0001, versus the saline group; # p < 0.05 versus the DM group.

