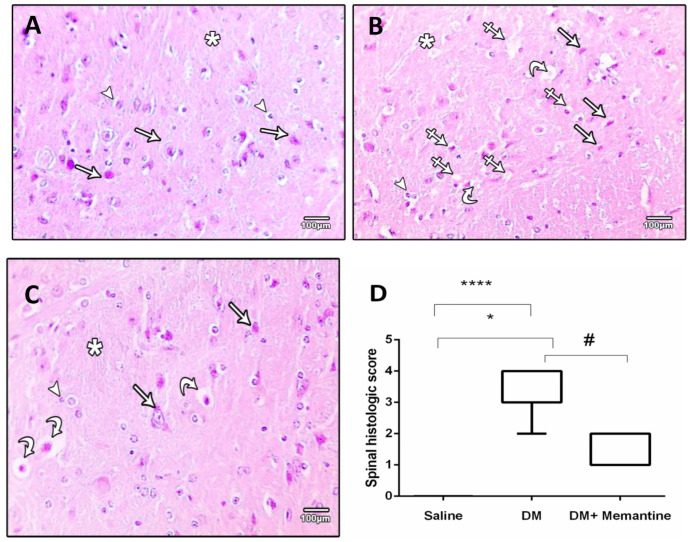
Figure 7.
Microscopic pictures of hematoxylin and eosin stained cross sections of spinal cord. (A) Saline group showing normal neural cells (arrows) and glia cells (arrow heads) surrounded by neuropils (star). (B) Diabetic group (DM) showing marked neural cell degeneration (arrows), vacuoles in the neuropils (crossed arrow), dilated capillaries (curved arrows), and gliosis (arrow head). (C) DM+memantine group showing preserved neural cells (arrows) and glial cells (arrow head) with reduced vacuolation in the neuropil (curved arrows). ×100; bar 100 µm. (D) box-plot demonstrating the medians of the histopathologic scores assigned for the spinal cord specimens. Analysis was done using Kruskal–Wallis ANOVA. * p < 0.05, and **** p < 0.0001 versus the saline group; # p < 0.05 versus the DM group.

